For anyone tracking the growth of the clean economy, the annual Carbon Clean 200 list provides a striking perspective. Since 2016, the shareholder-advocacy non-profit As You Sow and Corporate Knights have zeroed in on total sustainable revenues at public companies worldwide in order to show both the share and scale of sustainable revenues in absolute terms.
“The Clean200 follows revenues, not rhetoric,” Toby Heaps, CEO of Corporate Knights and report co-author, said in a statement. “Even when politics turns hostile, markets continue to reward companies that are supplying what the global economy is structurally demanding – clean power, electrification, efficiency, and resilient infrastructure.”
For the 200 companies that made this year’s list, revenue from sustainable activities reached a record high of US$2.8 trillion, up 12% from last year and 710% from 2017. On average, more than half the revenue (53.7%) at Clean200 companies is sustainable – roughly 15 percentage points higher than five years ago – whereas companies in the MSCI All Country World Index (ACWI) generate only 16.7% of their revenue from sustainable activities.
“In 2016, we created the Clean200 in response to investors who asked, ‘As we shift away from fossil fuels, what should we invest in?’” Andrew Behar, CEO of As You Sow and report co-author, said in a statement. “A decade later, the Clean200 continues to demonstrate that the global economy is increasingly driven by companies delivering solutions that reduce dependence on fossil fuels and resource-intensive systems.”
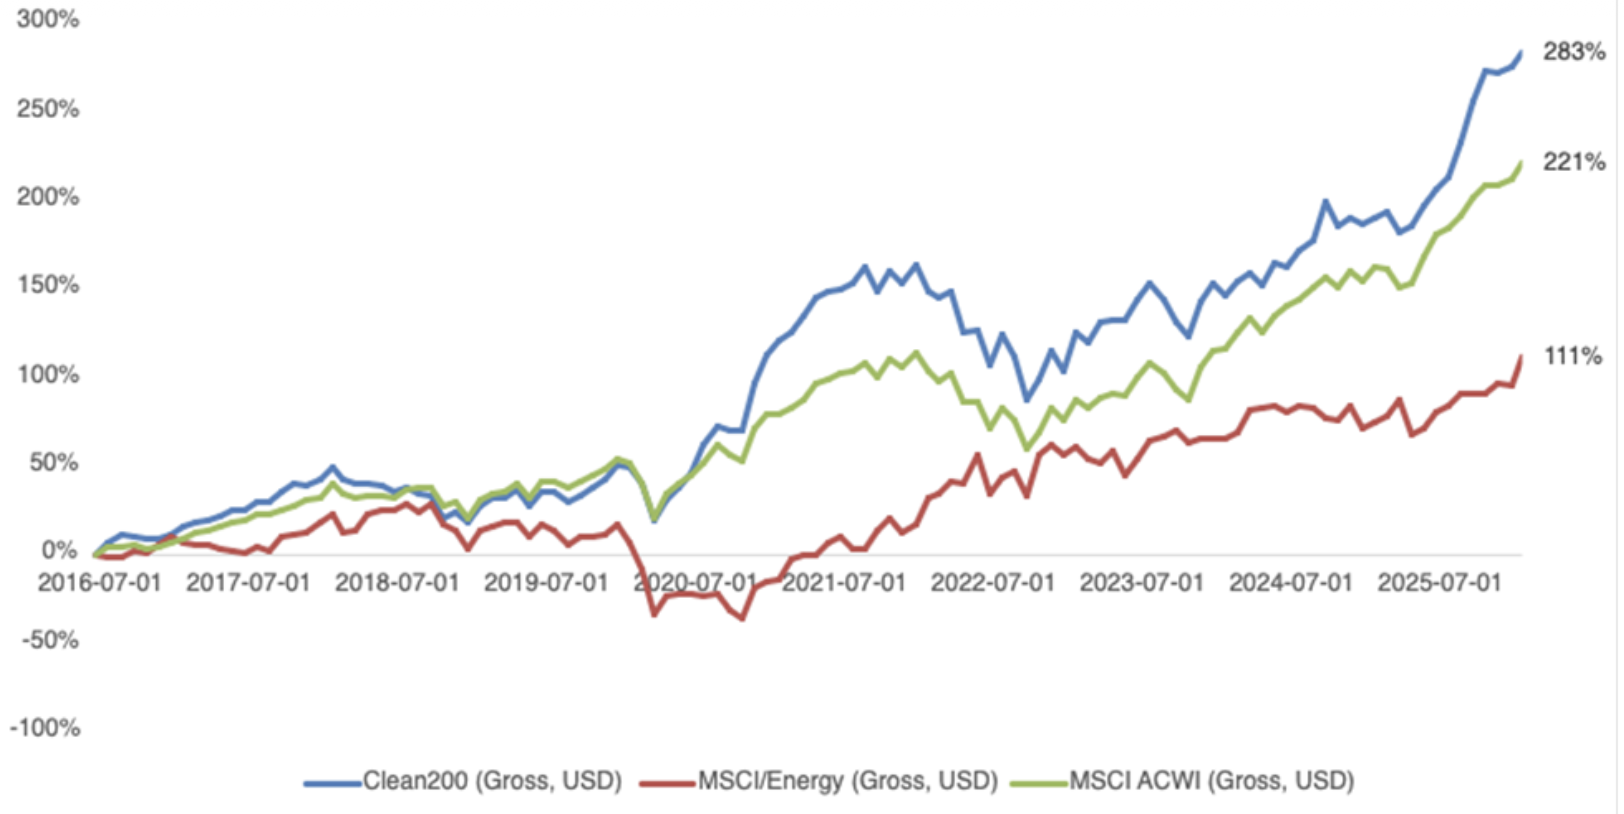
Over the past decade, investors in Clean200 companies beat the benchmark by a wide margin. From July 1, 2016, to January 26, 2026, the Clean200 portfolio returned 282.9%, compared with 221.3% for the MSCI ACWI. The fossil fuel benchmark, meanwhile, returned a much slimmer 111%. In other words, the Clean200 produced about 2.5 times the gain of the fossil fuel benchmark.
The Clean200 is selected from 8,229 eligible companies, of which 103 were excluded. The list employs a wide range of negative screens to exclude: for example, fossil-fired utilities or big banks and insurers financing fossil fuel companies, as well as for-profit prisons, weapons makers and others.
Looking back five years, the Clean200 demonstrates the increasing economic weight of all-in sustainability firms known as “pure plays,” such as electric-vehicle makers and renewable-power generators. Since 2021, the share of pure-play sustainability companies – those for whom more than 99% of revenues are sustainable – has increased by 175%, from eight to 22. Near pure-plays, or those with greater than a 90% ratio, increased 216.7%, from 12 to 38. And those with more than 80% sustainable revenue also increased dramatically, from 22 to 49.
The United States and China have 69 companies on the list between them, 41 and 28 respectively. Five years ago, the United States had 46 companies on the list, and China had 17, which suggests a subtle but marked rebalancing trend. About half the list consists of “middle power” countries: Japan (15), France (12), Canada (11), Germany (11), Spain (8), Brazil (8), South Korea (7), Denmark (7), United Kingdom (5), Sweden (5) and India (5). Sixteen other countries share the remaining 14.5% of the list, underscoring how widely distributed the clean‑economy opportunity has become.
| Rank | Name | Sector | Location of Headquarters | 2024 Sustainable Revenue Ratio | 2024 Sustainable Revenue (PPP$) |
|---|---|---|---|---|---|
| 1 | Apple Inc | Information Technology | United States of America | 65.9% | $257,861,000,000 |
| 2 | Amazon.com Inc | Consumer Discretionary | United States of America | 16.9% | $107,556,000,000 |
| 3 | Microsoft Corp | Information Technology | United States of America | 37.7% | $106,265,000,000 |
| 4 | Tesla Inc | Consumer Discretionary | United States of America | 100.0% | $97,690,000,000 |
| 5 | Contemporary Amperex Technology Co Ltd | Industrials | China | 98.5% | $93,845,630,692 |
| 6 | Byd Co Ltd | Consumer Discretionary | China | 39.7% | $81,255,847,855 |
| 7 | Taiwan Semiconductor Manufacturing Company Limited | Information Technology | Taiwan | 38.7% | $80,718,572,501 |
| 8 | NVIDIA Corp | Information Technology | United States of America | 57.5% | $75,000,000,000 |
| 9 | Volkswagen AG | Consumer Discretionary | Germany | 10.1% | $52,826,447,665 |
| 10 | China Railway Group Ltd | Industrials | China | 12.9% | $39,540,115,688 |
| 11 | HP Inc | Information Technology | United States of America | 67.5% | $36,163,000,000 |
| 12 | Bayerische Motoren Werke AG | Consumer Discretionary | Germany | 15.1% | $34,679,151,598 |
| 13 | Industria de Diseno Textil SA | Consumer Discretionary | Spain | 53.8% | $33,443,265,940 |
| 14 | LG Energy Solution, Ltd. | Industrials | South Korea | 100.0% | $33,431,356,302 |
| 15 | LG Chem Ltd | Materials | South Korea | 52.4% | $33,418,228,216 |
| 16 | Lenovo Group Ltd | Information Technology | Hong Kong | 45.7% | $31,570,689,617 |
| 17 | Iberdrola SA | Utilities | Spain | 41.5% | $29,868,532,416 |
| 18 | Schneider Electric SE | Industrials | France | 48.5% | $29,816,425,121 |
| 19 | Alstom SA | Industrials | France | 98.7% | $29,392,351,047 |
| 20 | Vestas Wind Systems A/S | Industrials | Denmark | 100.0% | $27,850,241,546 |
| 21 | Nokia Oyj | Information Technology | Finland | 89.8% | $27,801,932,367 |
| 22 | Merck & Co Inc | Health Care | United States of America | 40.2% | $25,772,486,727 |
| 23 | Telefonaktiebolaget LM Ericsson | Information Technology | Sweden | 88.7% | $25,074,660,891 |
| 24 | Banco do Brasil SA | Financials | Brazil | 18.9% | $24,623,407,108 |
| 25 | Bristol-Myers Squibb Co | Health Care | United States of America | 44.3% | $21,414,750,000 |
| 26 | CRRC Corp Ltd | Industrials | China | 31.6% | $20,518,660,174 |
| 27 | Smurfit WestRock PLC | Materials | Ireland | 59.4% | $20,190,885,668 |
| 28 | Neoenergia SA | Utilities | Brazil | 79.5% | $20,142,622,272 |
| 29 | Sungrow Power Supply Co Ltd | Industrials | China | 97.9% | $20,065,338,855 |
| 30 | Cisco Systems Inc | Information Technology | United States of America | 37.2% | $20,013,736,015 |
| 31 | Novo Nordisk A/S | Health Care | Denmark | 18.6% | $19,979,292,147 |
| 32 | Geely Automobile Holdings Ltd | Consumer Discretionary | Hong Kong | 31.3% | $19,802,912,617 |
| 33 | Vinci SA | Industrials | France | 16.6% | $19,405,925,926 |
| 34 | Li Auto Inc | Consumer Discretionary | China | 50.0% | $19,012,891,024 |
| 35 | Rio Tinto Ltd | Materials | Australia | 35.4% | $18,997,668,775 |
| 36 | Sanofi SA | Health Care | France | 27.1% | $17,897,095,597 |
| 37 | Seres Group Co.,Ltd | Consumer Discretionary | China | 46.7% | $17,832,393,558 |
| 38 | NIO Inc | Consumer Discretionary | China | 100.0% | $17,302,331,929 |
| 39 | GlaxoSmithKline PLC | Health Care | United Kingdom | 37.3% | $17,047,199,860 |
| 40 | Acciona SA | Utilities | Spain | 54.2% | $16,734,906,475 |
| 41 | Steel Dynamics Inc | Materials | United States of America | 91.8% | $16,102,290,435 |
| 42 | Johnson Controls International PLC | Industrials | Ireland | 57.9% | $15,864,964,259 |
| 43 | Volvo Car AB (publ.) | Consumer Discretionary | Sweden | 34.5% | $15,739,283,027 |
| 44 | Central Japan Railway Co | Industrials | Japan | 77.0% | $15,510,999,340 |
| 45 | Prysmian SpA | Industrials | Italy | 56.5% | $15,486,312,399 |
| 46 | Bouygues SA | Industrials | France | 16.5% | $15,107,890,499 |
| 47 | AT&T Inc | Communication Services | United States of America | 12.3% | $15,020,055,000 |
| 48 | Ricoh Co Ltd | Information Technology | Japan | 53.8% | $14,944,129,288 |
| 49 | Goldwind Science & Technology Co., Ltd. | Industrials | China | 99.7% | $14,876,601,737 |
| 50 | Fresenius Medical Care AG | Health Care | Germany | 45.7% | $14,217,035,427 |
| 51 | Asustek Computer Inc | Information Technology | Taiwan | 33.2% | $14,044,173,606 |
| 52 | Verizon Communications Inc | Communication Services | United States of America | 10.2% | $13,803,900,000 |
| 53 | China United Network Communications Ltd | Communication Services | China | 13.3% | $13,660,502,764 |
| 54 | SAP SE | Information Technology | Germany | 24.5% | $13,482,286,634 |
| 55 | Abb Ltd | Industrials | Switzerland | 39.6% | $12,998,000,000 |
| 56 | East Japan Railway Co | Industrials | Japan | 40.7% | $12,929,611,917 |
| 57 | Nike Inc | Consumer Discretionary | United States of America | 26.3% | $12,162,569,209 |
| 58 | Adidas AG | Consumer Discretionary | Germany | 31.8% | $12,113,676,564 |
| 59 | CPFL Energia SA | Utilities | Brazil | 74.8% | $11,989,746,071 |
| 60 | Gilead Sciences Inc | Health Care | United States of America | 41.2% | $11,844,490,000 |
| 61 | Nordex SE | Industrials | Germany | 100.0% | $11,753,341,385 |
| 62 | DaVita Inc | Health Care | United States of America | 88.1% | $11,294,614,000 |
| 63 | CEMIG | Utilities | Brazil | 75.3% | $11,284,405,619 |
| 64 | Kering SA | Consumer Discretionary | France | 39.9% | $11,051,755,233 |
| 65 | Telefonica SA | Communication Services | Spain | 16.3% | $10,819,806,763 |
| 66 | Essity AB | Consumer Staples | Sweden | 65.1% | $10,793,928,189 |
| 67 | XPeng Inc. | Consumer Discretionary | China | 100.0% | $10,757,122,664 |
| 68 | Tianneng Power International Ltd | Consumer Discretionary | China | 53.0% | $10,694,365,096 |
| 69 | Enerjisa Enerji AS | Utilities | Turkey | 39.1% | $10,298,864,798 |
| 70 | Johnson & Johnson | Health Care | United States of America | 11.4% | $10,169,873,363 |
| 71 | Bharti Airtel Ltd | Communication Services | India | 13.0% | $10,165,293,003 |
| 72 | Kone Oyj | Industrials | Finland | 55.5% | $9,917,717,762 |
| 73 | AstraZeneca PLC | Health Care | United Kingdom | 18.1% | $9,806,172,745 |
| 74 | T-Mobile US Inc | Communication Services | United States of America | 11.6% | $9,410,850,000 |
| 75 | Enel Americas SA | Utilities | Chile | 67.5% | $9,389,590,604 |
| 76 | Energisa SA | Utilities | Brazil | 73.7% | $9,345,229,002 |
| 77 | Guangzhou Automobile Group Co Ltd | Consumer Discretionary | China | 32.7% | $9,287,816,267 |
| 78 | WSP Global Inc | Industrials | Canada | 69.1% | $9,220,578,860 |
| 79 | Dassault Systemes SE | Information Technology | France | 92.0% | $9,205,333,333 |
| 80 | Arcelik AS | Consumer Discretionary | Turkey | 15.5% | $9,145,920,938 |
| 81 | Trane Technologies PLC | Industrials | Ireland | 46.0% | $9,125,572,000 |
| 82 | Orange SA | Communication Services | France | 13.9% | $8,999,475,040 |
| 83 | Orsted A/S | Utilities | Denmark | 79.4% | $8,919,132,911 |
| 84 | Signify NV | Industrials | Netherlands | 90.0% | $8,902,898,551 |
| 85 | Hyundai Mobis Co Ltd | Consumer Discretionary | South Korea | 11.7% | $8,742,924,104 |
| 86 | Outokumpu Oyj | Materials | Finland | 90.8% | $8,688,647,343 |
| 87 | Quanta Services Inc | Industrials | United States of America | 35.9% | $8,499,884,000 |
| 88 | GEM Co Ltd | Materials | China | 95.7% | $8,359,791,898 |
| 89 | Hanwha Solutions Corp | Materials | South Korea | 51.6% | $8,341,074,919 |
| 90 | Legrand SA | Industrials | France | 59.9% | $8,340,417,069 |
| 91 | Newmont Corporation | Materials | United States of America | 43.8% | $8,174,074,282 |
| 92 | Ball Corp | Materials | United States of America | 69.2% | $8,166,640,000 |
| 93 | UACJ Corp | Materials | Japan | 73.9% | $8,114,700,967 |
| 94 | Dr. Ing. h.c. F. Porsche AG | Consumer Discretionary | Germany | 12.1% | $7,834,138,486 |
| 95 | Abbott Laboratories | Health Care | United States of America | 18.5% | $7,778,500,000 |
| 96 | West Japan Railway Co | Industrials | Japan | 41.0% | $7,707,167,986 |
| 97 | Ecolab Inc | Materials | United States of America | 48.7% | $7,671,303,343 |
| 98 | China Three Gorges Renewables Group Co Ltd | Utilities | China | 97.9% | $7,659,514,108 |
| 99 | Yadea Group Holdings Ltd | Consumer Discretionary | China | 100.0% | $7,432,546,986 |
| 100 | Vodafone Group PLC | Communication Services | United Kingdom | 12.3% | $7,429,468,599 |
| 101 | Takeda Pharmaceutical Co Ltd | Health Care | Japan | 14.2% | $7,169,261,214 |
| 102 | Republic Services Inc | Industrials | United States of America | 44.7% | $7,160,500,000 |
| 103 | Konica Minolta Inc | Information Technology | Japan | 57.4% | $7,112,375,704 |
| 104 | Companhia Paranaense de Energia | Utilities | Brazil | 82.2% | $7,006,050,926 |
| 105 | Verbund AG | Utilities | Austria | 52.7% | $7,002,673,108 |
| 106 | Xylem Inc | Industrials | United States of America | 81.4% | $6,968,100,000 |
| 107 | Crown Holdings Inc | Materials | United States of America | 59.0% | $6,962,590,000 |
| 108 | Delta Electronics Thailand PCL | Information Technology | Thailand | 48.3% | $6,940,750,240 |
| 109 | Commercial Metals Co | Materials | United States of America | 84.2% | $6,669,705,438 |
| 110 | Brambles Ltd | Industrials | Australia | 100.0% | $6,669,700,000 |
| 111 | Bridgestone Corp | Consumer Discretionary | Japan | 13.6% | $6,623,714,336 |
| 112 | Infineon Technologies AG | Information Technology | Germany | 27.1% | $6,520,128,824 |
| 113 | Aperam SA | Materials | Luxembourg | 64.7% | $6,512,523,455 |
| 114 | Air Liquide S.A. | Materials | France | 14.7% | $6,398,293,076 |
| 115 | Equinix Inc | Information technology | United States of America | 72.0% | $6,298,560,000 |
| 116 | H & M Hennes & Mauritz AB | Consumer Discretionary | Sweden | 23.3% | $6,227,444,888 |
| 117 | BCE Inc | Communication Services | Canada | 30.3% | $6,097,676,301 |
| 118 | FirstGroup PLC | Industrials | United Kingdom | 81.9% | $6,039,368,828 |
| 119 | Great Wall Motor Co Ltd | Consumer Discretionary | China | 11.3% | $6,005,163,782 |
| 120 | Rexel SA | Industrials | France | 19.0% | $5,900,433,172 |
| 121 | Canadian National Railway Co | Industrials | Canada | 41.6% | $5,861,271,676 |
| 122 | Acerinox SA | Materials | Spain | 66.9% | $5,830,974,557 |
| 123 | Koninklijke Philips NV | Health Care | Netherlands | 19.9% | $5,778,840,580 |
| 124 | Zhuzhou CRRC Times Electric Co Ltd | Industrials | China | 86.4% | $5,666,754,409 |
| 125 | Rengo Co Ltd | Materials | Japan | 51.1% | $5,579,528,584 |
| 126 | Telus Corp | Communication Services | Canada | 33.5% | $5,568,778,541 |
| 127 | Gotion High-tech Co Ltd | Industrials | China | 59.7% | $5,557,388,623 |
| 128 | Cellnex Telecom SA | Communication Services | Spain | 78.7% | $5,515,050,721 |
| 129 | Manulife Financial Corp | Financials | Canada | 11.4% | $5,503,304,136 |
| 130 | Boston Scientific Corp | Health Care | United States of America | 32.1% | $5,377,500,000 |
| 131 | Rockwool A/S | Industrials | Denmark | 86.2% | $5,351,046,699 |
| 132 | Beijing Enterprises Water Group Ltd | Utilities | Hong Kong | 82.7% | $5,285,509,213 |
| 133 | Risen Energy Co Ltd | Information Technology | China | 97.2% | $5,179,272,336 |
| 134 | Eisai Co Ltd | Health Care | Japan | 59.2% | $5,136,492,696 |
| 135 | Eli Lilly and Co | Health Care | United States of America | 11.4% | $5,134,377,000 |
| 136 | Giant Manufacturing Co Ltd | Consumer Discretionary | Taiwan | 100.0% | $5,134,248,505 |
| 137 | Adani Green Energy Ltd | Utilities | India | 99.3% | $5,020,977,128 |
| 138 | Pandora A/S | Consumer Discretionary | Denmark | 100.0% | $5,012,658,228 |
| 139 | EVE Energy Co., Ltd. | Industrials | China | 39.1% | $5,008,402,634 |
| 140 | Shanying International Holdings Co Ltd | Materials | China | 66.1% | $5,002,687,335 |
| 141 | voestalpine AG | Materials | Austria | 19.6% | $4,976,478,100 |
| 142 | Rivian Automotive, Inc. | Consumer Discretionary | United States of America | 100.0% | $4,970,000,000 |
| 143 | Sims Ltd | Materials | Australia | 100.0% | $4,950,328,947 |
| 144 | Suzlon Energy Ltd | Industrials | India | 100.0% | $4,895,258,718 |
| 145 | Acer Inc | Information Technology | Taiwan | 25.3% | $4,817,565,364 |
| 146 | Norsk Hydro ASA | Materials | Norway | 27.0% | $4,761,989,383 |
| 147 | Corning Inc | Information Technology | United States of America | 35.5% | $4,657,000,000 |
| 148 | Interconnection Electric SA ESP | Utilities | Colombia | 47.9% | $4,575,769,787 |
| 149 | Novonesis A/S | Materials | Denmark | 100.0% | $4,530,978,344 |
| 150 | Companhia de Saneamento Basico do Estado de Sao Paulo SABESP | Utilities | Brazil | 33.1% | $4,494,893,717 |
| 151 | MLS Co Ltd | Information Technology | China | 100.0% | $4,451,241,965 |
| 152 | Flat Glass Group Co., Ltd. | Information Technology | China | 90.0% | $4,426,455,436 |
| 153 | Siemens Ltd | Industrials | India | 43.7% | $4,383,091,984 |
| 154 | China Tower Corp Ltd | Communication Services | China | 16.8% | $4,331,271,387 |
| 155 | Canadian Pacific Kansas City Limited | Industrials | Canada | 35.8% | $4,305,945,500 |
| 156 | Zhejiang Leapmotor Technology Co., Ltd. | Consumer Discretionary | China | 50.0% | $4,233,243,485 |
| 157 | First Solar Inc | Information Technology | United States of America | 100.0% | $4,206,289,000 |
| 158 | Kurita Water Industries Ltd | Industrials | Japan | 93.0% | $4,180,716,799 |
| 159 | Greif Inc | Materials | United States of America | 76.7% | $4,179,406,000 |
| 160 | Sekisui Chemical Co Ltd | Consumer Discretionary | Japan | 28.9% | $4,118,843,448 |
| 161 | Ferrovial SA | Industrials | Spain | 27.7% | $4,079,571,638 |
| 162 | Engie Brasil Energia SA | Utilities | Brazil | 96.4% | $4,066,870,446 |
| 163 | Merck KGaA | Health Care | Germany | 11.9% | $4,051,933,188 |
| 164 | NKT A/S | Industrials | Denmark | 77.2% | $4,043,478,261 |
| 165 | Darling Ingredients Inc | Consumer Staples | United States of America | 70.7% | $4,040,829,000 |
| 166 | Olympus Corp | Health Care | Japan | 36.8% | $4,033,790,677 |
| 167 | Xinyi Solar Holdings Ltd | Information Technology | China | 99.7% | $4,008,206,049 |
| 168 | Waste Connections Inc | Industrials | Canada | 44.5% | $3,966,604,500 |
| 169 | Knorr Bremse AG | Industrials | Germany | 30.7% | $3,900,161,031 |
| 170 | Celestica Inc | Information Technology | Canada | 40.4% | $3,900,000,000 |
| 171 | China Railway Signal & Communication Corp Ltd | Information Technology | China | 45.3% | $3,889,416,980 |
| 172 | Taiwan High Speed Rail Corp | Industrials | Taiwan | 100.0% | $3,830,992,149 |
| 173 | EDP Renovaveis SA | Utilities | Spain | 99.5% | $3,820,297,377 |
| 174 | Astellas Pharma Inc | Health Care | Japan | 18.1% | $3,811,279,683 |
| 175 | Shimano Inc | Consumer Discretionary | Japan | 76.6% | $3,798,955,585 |
| 176 | BT Group PLC | Communication Services | United Kingdom | 12.6% | $3,743,208,418 |
| 177 | Amgen Inc | Health Care | United States of America | 11.1% | $3,706,746,130 |
| 178 | Stantec Inc | Industrials | Canada | 59.6% | $3,688,692,276 |
| 179 | Ecopro BM. Co., Ltd. | Industrials | South Korea | 100.0% | $3,610,485,441 |
| 180 | Puma SE | Consumer Discretionary | Germany | 25.1% | $3,563,795,813 |
| 181 | Clean Harbors Inc | Industrials | United States of America | 60.2% | $3,546,903,416 |
| 182 | Unibail-Rodamco-Westfield SE | Real Estate | France | 66.4% | $3,481,570,048 |
| 183 | Andritz AG | Industrials | Austria | 26.0% | $3,476,006,441 |
| 184 | Cascades Inc | Materials | Canada | 89.0% | $3,455,033,140 |
| 185 | SK Telecom Co Ltd | Communication Services | South Korea | 14.5% | $3,404,455,499 |
| 186 | GFL Environmental Inc | Industrials | Canada | 51.5% | $3,340,751,445 |
| 187 | Swatch Group AG | Consumer Discretionary | Switzerland | 50.0% | $3,330,860,534 |
| 188 | Power Grid Corporation of India Ltd | Utilities | India | 15.9% | $3,316,541,616 |
| 189 | Kimberly-Clark Corp | Consumer Staples | United States of America | 16.5% | $3,307,294,120 |
| 190 | Tung Ho Steel Enterprise Corp | Materials | Taiwan | 75.9% | $3,290,712,091 |
| 191 | Sonoco Products Co | Materials | United States of America | 61.7% | $3,273,410,205 |
| 192 | Longchen Paper & Packaging Co Ltd | Materials | Taiwan | 92.0% | $3,166,492,614 |
| 193 | SSAB AB | Materials | Sweden | 26.8% | $3,165,006,269 |
| 194 | Veralto Corp | Industrials | United States of America | 60.4% | $3,138,000,000 |
| 195 | Xerox Holdings Corp | Information Technology | United States of America | 50.4% | $3,137,640,030 |
| 196 | Posco Chemical Co Ltd | Industrials | South Korea | 63.3% | $3,055,537,272 |
| 197 | Meridian Energy Ltd | Utilities | New Zealand | 92.4% | $3,041,000,681 |
| 198 | Kimberly-Clark de Mexico SAB de CV | Consumer Staples | Mexico | 53.6% | $3,027,767,224 |
| 199 | Albemarle Corp | Materials | United States of America | 56.1% | $3,015,121,000 |
| 200 | Cheng Loong Corp | Materials | Taiwan | 90.8% | $2,954,261,776 |
The Weekly Roundup
Get all our stories in one place, every Wednesday at noon EST.