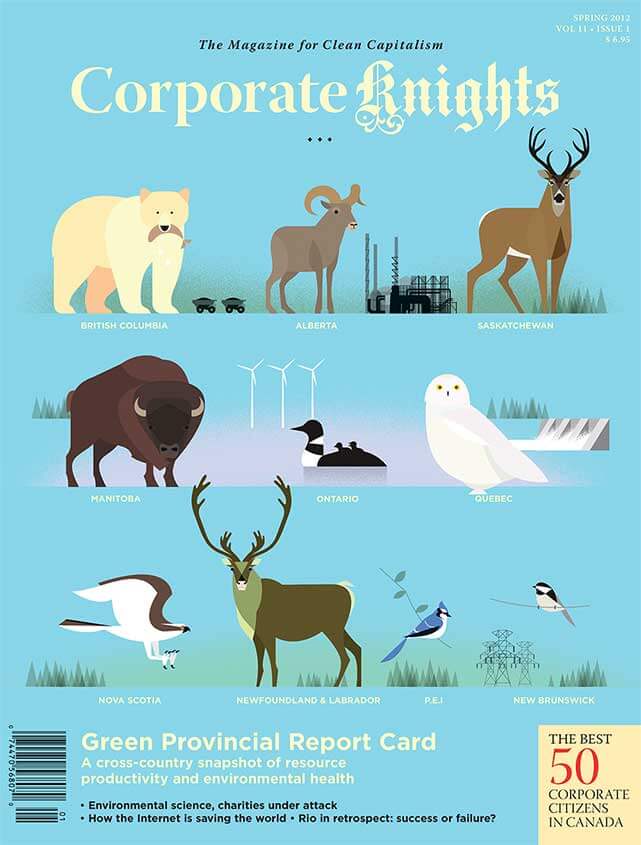
British Columbia:
Strengths:
A green-energy powerhouse that gets 89 per cent of its electricity from renewables and is a hotbed for clean technology innovation. In the area of transportation, B.C. is the province with the lowest vehicle-kilometres travelled per capita, for both heavy duty and light duty vehicles. B.C. is also one of the least wasteful provinces, with a relatively high GDP per tonne of waste disposed and one of the highest waste diversion rates in the country.
Weaknesses:
Gets low grade for water and could do much more to lower GHGs and other pollutants. B.C. had the lowest number of water stations with “normal” or “high” water quantity, a poor water quality score, and less than 60 per cent of its population is served with secondary wastewater treatment. GDP per kilotonne of GHG and non-GHG emissions are mostly above the national average, but not reflective of a province blessed with vast green-energy resources.
Alberta:
Strengths:
Rates high in the nature category with 12.4 per cent of land given protected status to conserve habitat of ecological importance. Also tops in percentage of forest land certified under Forest Stewardship Council and has relatively high visits per capita to national parks. In water category, is province with highest GDP per litre of water used. It hosts an above-average number of clean technology companies, while nearly 10 per cent of new housing starts are “green homes,” ahead of most provinces.
Weaknesses:
Low energy productivity, highest residential energy use per capita, and province with least amount of renewables in electricity mix at 5.72 per cent. Province with the highest number of kilometres travelled per capita, for both heavy duty and light duty vehicles. Second-highest GHGs per capita and second-lowest carbon productivity, reflecting oil sands growth and heavy dependence on fossil fuels for electricity generation. This is also reflected by high emissions of non-GHG pollutants, including NOx, VOCs and chromium.
Saskatchewan:
Strengths:
Performs well in water category. Has relatively low releases of mercury, lead and cadmium into water systems, and has secondary wastewater treatment for more than 90 per cent of population. Virtually all monitored water stations report normal or high quantities with fairly average quality ratings. Citizens keen on home efficiency. Province had highest number of applications per capita for the 2011/12 ecoENERGY home retrofit program.
Weaknesses:
Saskatchewan has one of the lowest GDPs per tonne of waste disposed and one of the lowest waste diversion rates in country. It has lowest energy productivity, the second-highest residential energy use per capita, and an electricity system heavily dependent on coal. Province with the second-highest number of kilometres travelled per capita for light duty vehicles and third-highest for heavy duty vehicles. Has highest GHGs per capita, lowest carbon productivity score, and saw highest growth of GHG emissions in the country between 1990 and 2009.
Manitoba:
Strengths:
Like Saskatchewan, Manitoba is a high performer in the water category, but also does well in energy. It has relatively high GDP per litre of water used and 98 per cent of population has secondary wastewater treatment. As well, all water monitoring stations show normal or high levels and there is below-average release of toxins. Manitoba’s electricity mix is virtually 100 per cent renewable.
Weaknesses:
Its economy is wasteful. It only produces $40,000 in GDP for every tonne of waste disposed – putting it tied for last place with Quebec – and it has the lowest waste diversion per capita in Canada. In transportation, its heavy-duty vehicle fleet averages second-highest kilometres travelled per capita (provinces only) and has the lowest fuel efficiency in the country. Its national parks, meanwhile, score lowest on ecological integrity.
Ontario:
Strengths:
Still on a path to phase out coal power and phase in more renewables, Ontario already scores high in air and climate. It generates the most GDP per kilotonne of NOx, VOCs, and particulates, and for every megatonne of CO2-equivalent GHGs. It has reduced GHGs by 6.5 per cent since 1990, making it the only province to reach Kyoto emission-reduction targets. It gets high marks for building green homes and embracing energy retrofits for old ones, and is a clean technology leader.
Weaknesses:
Waste diversion per capita is below the national average. Among provinces, it has the lowest visits per capita to national parks. Its residential sector’s energy use per capita is slightly below the national average. In the area of water, it scores near the bottom because of high levels of mercury, lead and cadmium releases relative to the other provinces.
Quebec:
Strengths:
The province scores well in the air and climate category, having reduced its GHG emissions by 1.9 per cent since 1990. Also leads the country with the lowest GHG levels per capita. An emphasis on boreal forest protection has led to over 50 per cent of its forests being FSC certified. Hydro-electric power continues to power the province, with 97 per cent of energy generation coming from renewable sources. Light vehicles are fuel efficient, burning 9.9 litres per 100 km.
Weaknesses:
Quebec receives lowest water score by maintaining poor water quality, releasing large amounts of mercury, lead and cadmium into streams and rivers, and consuming 706 litres of water a day per capita. National park visitation is sporadic, with under 1.5 million visits last year. The waste score is reduced due to the province being tied with Manitoba in generating the highest levels of waste compared to GDP output. Chromium emissions are elevated in the air and climate category.
New Brunswick:
Strengths:
Earns high grade in transportation, with lowest levels of heavy duty vehicle usage after B.C. New Brunswick is competitive on waste, with highest rate of diverted material per capita annually. The province’s water quality leads the nation, and it has the greatest percentage of cumulative species that are not in danger at 88 per cent. The population, along with that of Saskatchewan, took the greatest advantage of the federal
ecoENERGY home retrofit program.
Weaknesses:
Only 3.1 per cent of the province qualifies as a protected nature area, and there are no FSC certified forests. New Brunswick uses greatest amount of water per capita, and residential consumption is high. Inefficient levels of GHG per capita push air and climate scores down, along with elevated sulphur oxide and mercury emissions. Low energy productivity, along with inefficient residential energy use, places the province in front of only Alberta and Saskatchewan in energy category.
Nova Scotia:
Strengths:
Leads all provinces in waste management, mixing the most efficient levels of waste disposal per capita with a high diversion rate. National parks within provincial boundaries have the greatest ecological integrity, and cumulative species status score is high as well. Residential energy use per capita is tied for second in efficiency, and the province is home to greatest percentage of new green certified housing starts. It also maintains the third-largest number of cleantech companies per capita.
Weaknesses:
Nova Scotia has third-lowest air and climate score, due to GHG emissions growing 10.5 per cent since 1990, low levels of GHG efficiency, and elevated sulphur oxide levels. Energy ranking was affected by small amount of electricity generation, 12 per cent, being derived from renewables. Municipal wastewater treatment levels are low in the province, with only 31 per cent of residents living in areas with secondary wastewater treatment facilities or better.
Prince Edward Island:
Strengths:
Rates third on air and climate, with low GHG emissions per capita. The province has reduced its GHG emissions by 3.4 per cent since 1990. By treating 100 per cent of municipal wastewater and releasing no lead, cadmium or mercury, it is ranked third on its water score as well. Prince Edward Island is tied with Manitoba in generating the most energy, 99 per cent, from renewable sources, though this is largely because other sources of energy are bought from neighbouring provinces.
Weaknesses:
The province is ranked third from the bottom on nature, with smallest amount of protected area set aside, and the second-lowest cumulative species status score. Transportation category is affected by significant use of the least fuel-efficient heavy vehicles in the country. Water quality is poor, tied with Manitoba for the second-lowest rating after Quebec. Cleantech position is lowered because P.E.I. is one of only two provinces that has received no venture capital investments since 2002.
Newfoundland & Labrador:
Strengths:
Competitive in several nature categories, maintaining the strongest levels of ecological integrity in national parks, the second-highest score in species protection, and a high volume of Parks Canada visitation. In the transportation category, heavy vehicles in Newfoundland are second in fuel efficiency. They are driven rarely, at an average of 437 km per capita. The 97 per cent of electricity generation coming from renewables boosts its energy ranking.
Weaknesses:
Newfoundland has the lowest innovation score due to the lack of venture capital investment over the past decade, as well as containing the smallest number of cleantech companies per capita of any province. Water quality and treatment is low, as only 7.9 per cent of the population has secondary wastewater treatment or better. The province’s nature indicators suffer as a result of no FSC certified forests, and just 4.6 per cent of land being designated as a protected area.


