As the global economic transition accelerates, more companies are recognizing that sustainability isn’t just good marketing – it’s good for business, too. The global effort to align our economic systems with the planet’s carrying capacity has lately acquired newfound urgency. We need to transition faster.
This was the animating spirit of the new methodology behind the Corporate Knights Global 100 ranking. The revised methodology introduces “sustainable revenue momentum” to measure how fast companies are growing their sustainable revenues. This metric now accounts for one-third of a company’s score, with overall sustainable revenues and sustainable investments accounting for the other two-thirds.
“We’re firing a shot across the bow that speed matters,” Corporate Knights CEO Toby Heaps says.
A change of method
The new momentum metric marks a broader shift in the ranking methodology. Last year, sustainable revenues and investments together accounted for 50% of the score, and the other 50% was scored across 22 common environmental, governance and social performance indicators (KPIs) such as water use, emissions, workplace fatalities, and diversity on the board and among executives.
The change has reordered the deck in a big way. The revenue growth criteria helped Pandora, a popular Danish jewellery manufacturer, shoot up from 48th spot in the 2025 rankings to number two.
The companies in fourth and sixth place – Fluence Energy, the maker of utility-scale battery energy storage systems headquartered in Arlington, Virginia, and the Denver-based healthcare company DaVita Inc. – are both new to the ranking. Seven other U.S. companies joined the G100 this year, bringing the U.S. total to 20, the most of any country. “[It’s] an interesting rebuttal,” Heaps points out, “to the noise that the United States is bailing on the sustainable economy.”
For fairness, some energy companies were granted a temporary act-of-war exemption from the momentum criteria. The provision is necessary, Heaps says, to prevent companies from being penalized for distortions caused by Russia’s invasion of Ukraine, which drove prices sharply higher in 2022 before they fell again in 2024.
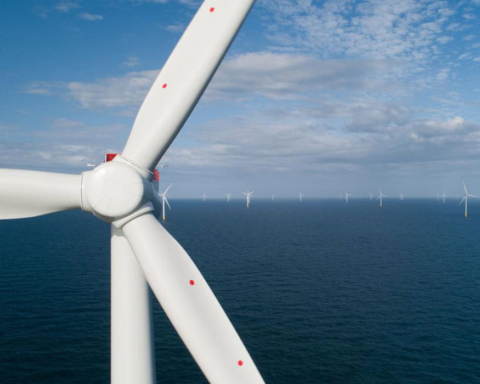
The G100 leader, ERG SpA, an Italian power generation company, rose dramatically from 18 to number one. Even amid the extreme wartime volatility and the sale of all its fossil fuel assets, ERG managed to increase its power output from wind and solar sources by more than 2,000 gigawatt-hours between 2022 and 2024.
Overall, 33 companies from last year’s ranking failed to make this year’s list, and four were no longer eligible either because they went private or their revenues fell under $1 billion, while 37 new companies entered the ranking. Only two companies – Ørsted, the power generator out of Denmark, ranked ninth, and Taiwan High Speed Rail Corp, ranked fifth – retained their positions from last year.
A dramatic departure?
The big changes may seem to signify a dramatic departure, but the designers of the methodology disagree. The rankings retain the same exclusionary screens and flags captured by many of the previous KPIs. For example, companies that register workplace fatalities, fines, et cetera, are penalized or excluded as they were in the past. The ranking also retains quotas for various industries so that manufacturers compete on the same sustainability terms as other manufacturers, banks against banks, wind and solar companies against other renewable-energy providers, and so on.
“What really matters to us is the contribution [these companies] are making to the low-carbon economy,” says Michael Yow, the director of rankings for Corporate Knights. According to Yow, the new streamlined methodology at once simplifies and standardizes reporting while differentiating the rankings from other international lists.
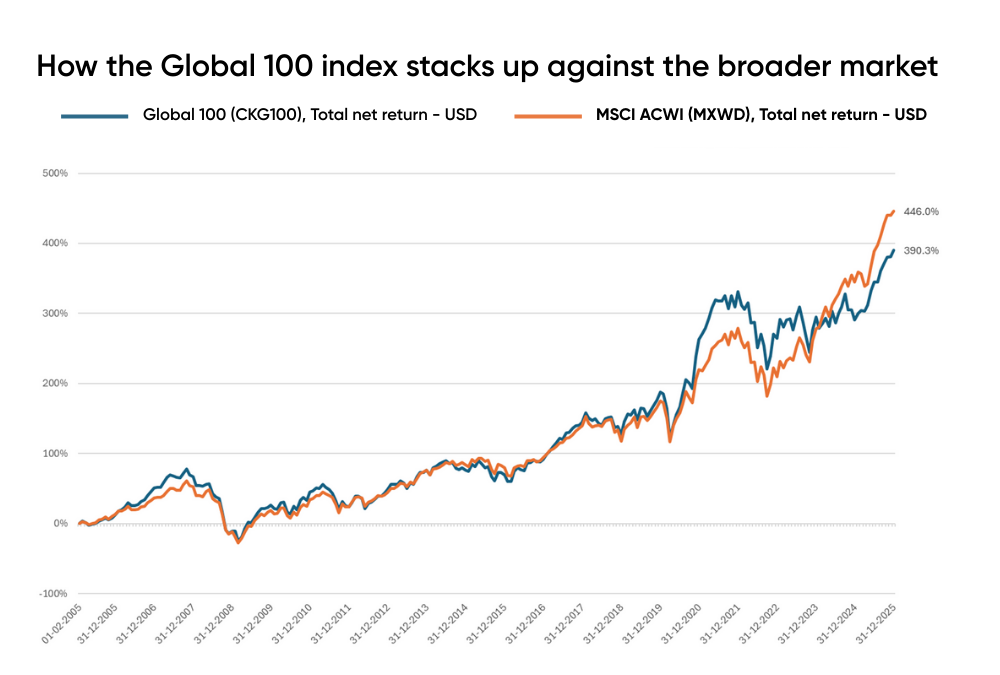
“In terms of performance, the G100 companies are back in top form, beating the benchmark MSCI AWCI index over the past year,” Heaps says, referring to a stock market index of 85% of global investable equities across almost 50 countries. He adds that the G100 underperformed the financial benchmark in recent years because of the Russia/Ukraine war, which led to spikes in oil prices, higher interest rates and increased military spending, improving the fortunes of companies excluded from the G100 list.
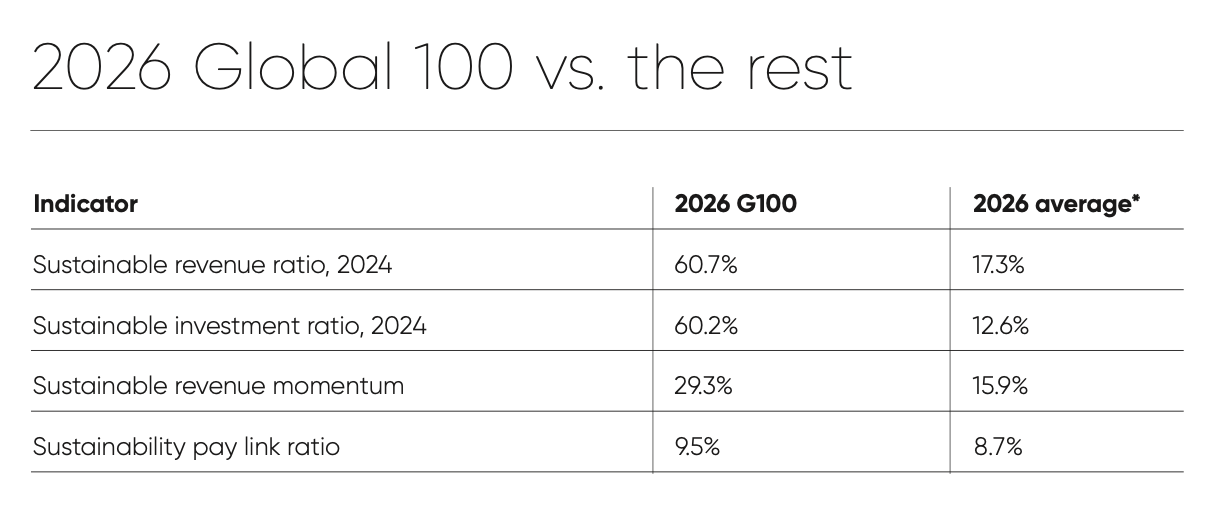
Sustainable revenues account for up to 61% of total revenues for ranked companies, versus just 17.3% for all other publicly listed companies. And despite it being a much larger chunk of their business, sustainable revenues for G100 companies are growing on average at double the rate of all their other revenues.
That momentum matters more than ever. The target of limiting global warming to 1.5°C has fallen conclusively out of reach, and the consequences from each additional 10th of a degree of warming are compounding exponentially. At the same time, the race to seize the opportunities from the green transition is heating up. G100 companies see the future and they’re moving toward it – some faster than others.
Tristan Bronca is a magazine writer and editor based in Newmarket, Ontario.
2026 Global 100
| Rank 2026 | Rank 2025 | Company | Country | Peer group | Sustainable revenue momentum | Sustainable revenue ratio | Sustainable investment ratio | Letter grade |
|---|---|---|---|---|---|---|---|---|
| 1 | 18 | ERG SpA | Italy | Power Generation | N.A. | 100.0% | 100.0% | A+ |
| 2 | 48 | Pandora A/S | Denmark | Furniture and general manufacturing | 40.1% | 100.0% | 100.0% | A |
| 3 | 38 | EDP Renováveis SA | Spain | Power Generation | N.A. | 99.5% | 96.2% | A |
| 4 | Fluence Energy, Inc | U.S. | Machinery Manufacturing | 50.0% | 100.0% | 100.0% | A | |
| 5 | 5 | Taiwan High Speed Rail Corp | Taiwan | Transit and ground transportation | 19.7% | 100.0% | 100.0% | A |
| 6 | DaVita Inc | U.S. | Health care | 3.8% | 88.1% | 89.3% | A | |
| 7 | 56 | Rivian Automotive, Inc | U.S. | Cars and trucks manufacturing, including parts | 73.1% | 100.0% | 100.0% | A |
| 8 | 49 | Novonesis A/S | Denmark | Pharmaceutical and biotech manufacturing | 27.7% | 100.0% | 100.0% | A |
| 9 | 9 | Ørsted A/S | Denmark | Power Generation | N.A. | 79.4% | 99.4% | A |
| 10 | Suzlon Energy Ltd | India | Machinery Manufacturing | 35.1% | 100.0% | 100.0% | A | |
| 11 | Meridian Energy Ltd | New Zealand | Power Generation | 24.7% | 92.4% | 100.0% | A | |
| 12 | Sungrow Power Supply Co Ltd | China | Electrical equipment manufacturing | 38.9% | 97.9% | 100.0% | A | |
| 13 | NKT A/S | Denmark | Electrical equipment manufacturing | 75.6% | 77.2% | 71.2% | A | |
| 14 | 34 | BCE Inc | Canada | Telecom providers | 12.8% | 30.3% | 81.7% | A |
| 15 | GEM Co Ltd | China | Waste Management | 6.6% | 95.7% | 100.0% | A | |
| 16 | DexCom Inc | U.S. | Medical equipment manufacturing | 17.7% | 50.0% | 100.0% | A | |
| 17 | 76 | Xinyi Solar Holdings Ltd | China | Glass and ceramics | 11.5% | 99.7% | 100.0% | A |
| 18 | Getlink SE | France | Freight transport, all modes | 2.5% | 77.8% | 99.6% | A | |
| 19 | 37 | Wheaton Precious Metals Corp | Canada | Asset management | 18.5% | 32.0% | Not applicable | A |
| 20 | 32 | XPeng Inc | China | Cars and trucks manufacturing, including parts | 23.4% | 100.0% | 100.0% | A |
| 21 | 46 | Telus Corp | Canada | Telecom providers | 18.5% | 33.5% | 64.5% | A |
| 22 | Severn Trent PLC | United Kingdom | Water and sewage treatment | 25.4% | 73.4% | 97.7% | A | |
| 23 | 4 | Brambles Ltd | Australia | Furniture and general manufacturing | 4.8% | 100.0% | 100.0% | A |
| 24 | 30 | Acciona SA | Spain | Commercial building construction | 56.4% | 54.2% | 62.8% | A |
| 25 | 16 | Nordex SE | Germany | Machinery Manufacturing | 13.3% | 100.0% | 100.0% | A |
| 26 | 72 | Equinix Inc | U.S. | Data processing, hosting services | 34.4% | 72.0% | 1.3% | A |
| 27 | 41 | Verbund AG | Austria | Power transmission and distribution | N.A. | 52.7% | 85.9% | A |
| 28 | 24 | Unibail-Rodamco-Westfield SE | France | Real estate and leasing | 19.5% | 66.4% | 91.7% | A |
| 29 | 23 | Li Auto Inc | China | Cars and trucks manufacturing, including parts | 78.6% | 50.0% | 50.0% | A |
| 30 | 13 | Nio Inc | China | Cars and trucks manufacturing, including parts | 15.5% | 100.0% | 100.0% | A |
| 31 | Contemporary Amperex Technology Co Ltd | China | Battery manufacturing | 4.9% | 98.5% | 100.0% | A | |
| 32 | 6 | SMA Solar Technology AG | Germany | Semiconductor and electronic components manufacturing | 19.8% | 100.0% | 100.0% | A |
| 33 | 27 | WSP Global Inc | Canada | Business, engineering and personal services | 28.1% | 69.1% | 71.6% | A |
| 34 | 59 | Cascades Inc | Canada | Packaging | 5.4% | 89.0% | 23.6% | A |
| 35 | Industria de Diseño Textil SA | Spain | Retail, except grocery and auto | 121.5% | 53.8% | 0.5% | A- | |
| 36 | 35 | Eisai Co Ltd | Japan | Pharmaceutical and biotech manufacturing | 13.3% | 59.2% | 44.7% | A- |
| 37 | 31 | Dassault Systèmes SE | France | IT services except telecom and hosting | N.A. | 92.0% | 0.0% | A- |
| 38 | 12 | LG Energy Solution, Ltd | South Korea | Battery manufacturing | 0.0% | 100.0% | 100.0% | A- |
| 39 | 100 | Turkiye Sinai Kalkinma Bankasi | Turkey | Banks | 83.4% | 20.4% | Not applicable | A- |
| 40 | 1 | Schneider Electric SE | France | Electrical equipment manufacturing | 50.2% | 48.5% | 66.7% | A- |
| 41 | Xylem Inc | U.S. | Machinery Manufacturing | 20.7% | 81.4% | 84.5% | A- | |
| 42 | Ecolab Inc | U.S. | Basic inorganic chemicals and synthetics | 21.7% | 48.7% | 24.1% | A- | |
| 43 | Zhejiang Leapmotor Technology Co Ltd | China | Cars and trucks manufacturing, including parts | 61.2% | 50.0% | 50.0% | A- | |
| 44 | Gotion High-tech Co Ltd | China | Battery manufacturing | 25.5% | 59.7% | 59.6% | A- | |
| 45 | 68 | Arçelik AS | Turkey | Appliances and lighting fixtures manufacturing | 167.7% | 15.5% | 19.5% | A- |
| 46 | 2 | Sims Ltd | Australia | Waste Management | -3.5% | 100.0% | 100.0% | A- |
| 47 | 45 | Tesla Inc | U.S. | Cars and trucks manufacturing, including parts | 9.5% | 100.0% | 100.0% | B+ |
| 48 | 3 | Vestas Wind Systems A/S | Denmark | Machinery Manufacturing | 9.3% | 100.0% | 100.0% | B+ |
| 49 | 11 | Voltronic Power Technology Corp | Taiwan | Electrical equipment manufacturing | 0.2% | 100.0% | 100.0% | B+ |
| 50 | 36 | Kesko Oyj | Finland | Grocery stores | 15.9% | 3.7% | 3.7% | B+ |
| 51 | 62 | Novo Nordisk A/S | Denmark | Pharmaceutical and biotech manufacturing | 48.5% | 18.6% | 37.5% | B+ |
| 52 | 55 | MLS Co Ltd | China | Semiconductor and electronic components manufacturing | 1.2% | 100.0% | 100.0% | B+ |
| 53 | Nvidia Corp | U.S. | Computers and peripherals manufacturing | 123.5% | 57.5% | 0.8% | B+ | |
| 54 | Kone Oyj | Finland | Machinery Manufacturing | 32.5% | 55.5% | 40.9% | B+ | |
| 55 | Enviri Corp | U.S. | Waste Management | 4.2% | 87.6% | 93.6% | B+ | |
| 56 | Castellum AB | Sweden | Real estate and leasing | 6.5% | 90.1% | 69.3% | B+ | |
| 57 | 7 | Alstom SA | France | Non-road transport equipment manufacturing | 5.9% | 98.7% | 81.8% | B+ |
| 58 | 33 | Giant Manufacturing Co Ltd | Taiwan | Non-road transport equipment manufacturing | -12.0% | 100.0% | 100.0% | B+ |
| 58 | 10 | Enphase Energy Inc | United States of America | Semiconductor and electronic components manufacturing | -24.5% | 100.0% | 100.0% | B+ |
| 58 | 19 | Yadea Group Holdings Ltd | China | Non-road transport equipment manufacturing | -4.7% | 100.0% | 100.0% | B+ |
| 61 | Vonovia SE | Germany | Real estate and leasing | 127.5% | 26.8% | 19.2% | B+ | |
| 62 | Franco-Nevada Corp | Canada | Asset management | 15.7% | 15.6% | Not applicable | B+ | |
| 63 | Seres Group Co Ltd | China | Cars and trucks manufacturing, including parts | 133.1% | 46.7% | 13.6% | B+ | |
| 64 | Cellnex Telecom SA | Spain | Commercial building construction | 18.6% | 78.7% | 24.3% | B+ | |
| 65 | 29 | Steel Dynamics Inc | U.S. | Steel making | -10.8% | 91.8% | 100.0% | B+ |
| 66 | 75 | Sun Life Financial Inc | Canada | Insurance companies | 59.3% | 9.5% | Not applicable | B |
| 67 | SalMar ASA | Norway | Food and beverage manufacturing | 44.9% | 19.3% | 0.0% | B | |
| 68 | 93 | NatWest Group PLC | United Kingdom | Banks | 85.4% | 4.8% | Not applicable | B |
| 69 | 39 | City Developments Ltd | Singapore | Real estate and leasing | 6.2% | 56.0% | 73.8% | B |
| 70 | Puma SE | Germany | Textiles and clothing manufacturing | 28.2% | 25.1% | 2.2% | B | |
| 71 | 54 | Cisco Systems Inc | U.S. | Telephones and telecom equip manufacturing | 19.5% | 37.2% | 3.5% | B |
| 72 | TCC Group Holdings Co Ltd | Taiwan | Cement, lime and concrete | 22.0% | 10.0% | 30.0% | B | |
| 73 | 96 | BNP Paribas SA | France | Banks | 94.7% | 3.2% | Not applicable | B |
| 74 | 43 | Kering SA | France | Retail, except grocery and auto | 12.9% | 39.9% | 8.8% | B |
| 75 | LG Chem Ltd | South Korea | Refining, petrochemicals and basic organic chemicals | 0.0% | 52.4% | 80.2% | B | |
| 76 | 64 | BorgWarner Inc | U.S. | Cars and trucks manufacturing, including parts | 23.8% | 16.3% | 73.5% | B |
| 77 | 63 | Prologis Inc | U.S. | Real estate and leasing | 238.6% | 12.8% | 8.6% | B |
| 78 | Commercial Metals Co | U.S. | Metal products manufacturing | -7.8% | 84.2% | 91.1% | B- | |
| 79 | 74 | Telefônica Brasil SA | Brazil | Telecom providers | 9.7% | 8.4% | 68.5% | B- |
| 80 | 44 | Nokia Oyj | Finland | Telephones and telecom equip manufacturing | -11.2% | 89.8% | 78.6% | B- |
| 81 | 70 | Telefonaktiebolaget LM Ericsson | Sweden | Telephones and telecom equip manufacturing | -7.1% | 88.7% | 93.8% | B- |
| 82 | MMG Ltd | Australia | Mining, smelting and refining | 17.9% | 33.1% | 32.8% | B- | |
| 83 | P/F Bakkafrost | Faroe Islands | Food and beverage manufacturing | 8.0% | 18.4% | 1.3% | B- | |
| 84 | Telefónica SA | Spain | Telecom providers | 8.9% | 16.3% | 31.0% | B- | |
| 85 | 58 | SAP SE | Germany | IT services except telecom and hosting | 16.7% | 24.5% | 2.6% | B- |
| 86 | Lenovo Group Ltd | Hong Kong | Computers and peripherals manufacturing | 72.4% | 45.7% | 1.4% | B- | |
| 87 | 51 | Ricoh Co Ltd | Japan | Computers and peripherals manufacturing | 10.7% | 53.8% | 46.9% | C+ |
| 88 | 85 | McCormick & Company Inc | U.S. | Food and beverage manufacturing | N.A. | 11.3% | 21.3% | C+ |
| 89 | 66 | Autodesk Inc | U.S. | IT services except telecom and hosting | 13.5% | 47.9% | 0.0% | C+ |
| 90 | Darling Ingredients Inc | U.S. | Food and beverage manufacturing | -10.3% | 70.7% | 42.9% | C+ | |
| 91 | 40 | Neste Oyj | Finland | Refining, petrochemicals and basic organic chemicals | -16.3% | 31.9% | 60.6% | C+ |
| 92 | 60 | Atea ASA | Norway | Computers and peripherals manufacturing | 13.6% | 38.8% | 23.3% | C |
| 93 | 17 | Banco do Brasil SA | Brazil | Banks | 30.3% | 18.9% | Not applicable | C |
| 94 | AsusTek Computer Inc | Taiwan | Computers and peripherals manufacturing | 39.8% | 33.2% | 7.5% | C | |
| 95 | Celestica Inc | Canada | Semiconductor and electronic components manufacturing | 20.2% | 40.4% | 0.7% | C | |
| 96 | 83 | Vitasoy International Holdings Ltd | Hong Kong | Food and beverage manufacturing | 1.9% | 32.4% | 7.9% | C |
| 97 | Taiwan Semiconductor Manufacturing Co Ltd | Taiwan | Semiconductor and electronic components manufacturing | 20.1% | 38.7% | 18.2% | C | |
| 98 | 71 | Unilever PLC | United Kingdom | Personal products (retail chemical) | 12.1% | 4.3% | 0.3% | C |
| 99 | 95 | IGM Financial Inc | Canada | Asset management | 12.6% | 4.3% | Not applicable | C- |
| 100 | 79 | HP Inc | U.S. | Computers and peripherals manufacturing | -2.2% | 67.5% | 5.9% | C- |
Not applicable: Companies in the CKPG asset management, banks and insurance companies are not scored on the sustainable investment KPI.
N.A.: Companies were not scored on the sustainable revenue momentum KPI because of the absence of 2022 sustainable revenue data. In the case of EU-based CKPG power generation and power transmission and distribution, the sustainable revenue momentum KPI was not applied because of high volatility in electricity prices in 2022 due to the Russia-Ukraine war.
The Weekly Roundup
Get all our stories in one place, every Wednesday at noon EST.