If there’s one thing the private sector craves most from government, it’s clear, stable policies. But in the coming year, many businesses will have no such luck as they navigate major changes to the global tax and regulatory environment that has been encouraging investment in more sustainable technologies and practices.
While the new U.S. president will be taking aim at legislation that resulted in nearly US$300 billion in private-sector investments in clean energy, battery manufacturing and clean power generation, most business leaders recognize that concerns about a worsening climate crisis will grow regardless of shifting political winds. The costly impacts of climate change and, more than anything, the declining costs of low-carbon technologies continue to drive investment in solutions.
Corporate Knights’ Global 100 ranking of the world’s most sustainable firms, now in its 21st year, shows that the top firms continue to increase their investment in the green transition. Even with higher interest rates in recent years, leading corporations have expanded their sustainable investments, which has resulted in a growing share of income being derived from sustainable revenue sources.
“We’re finding that growth in sustainable revenues is outpacing all other revenues,” says Toby Heaps, co-founder and CEO of Corporate Knights. “Over the last five years for major global public companies, sustainable revenues are growing twice as fast as other revenues, and they now represent over $5 trillion of annual revenues for the 3,000 biggest companies that we track.”
“With sustainable investment, it’s the same story,” Heaps says. “Sustainable capital expenditure is growing twice as fast as all other capex.” That green investment is key to a more sustainable future, telling us where companies are going as opposed to where they currently derive their revenues.
The firms in the 2025 Global 100 ranking allocated 58% of their investments to sustainable projects in 2023, up from 55% in the prior year. That figure compares with sustainable investments of just 15% for the 8,259 other publicly traded companies with revenues of more than $1 billion in the Global 100 universe.
2025 Global 100
| 2025 Rank | 2024 Rank | Company | Headquarters | Peer group | Carbon productivity | % Taxes paid | CEO–average worker pay ratio | % Gender-diverse board directors | % Sustainable revenue | % Sustainable investment | Final grade | Climate commitments | |||
|---|---|---|---|---|---|---|---|---|---|---|---|---|---|---|---|
| 1 | 7 | Schneider Electric SE | Rueil-Malmaison, France | Electrical equipment mfg | $285,876 | 18% | 70:1 | 50% | 74% | 79% | A+ | 1.5°C, SBTi | |||
| 2 | 1 | Sims Ltd | Mascot, Australia | Waste management | $46,412 | 14% | 49:1 | 38% | 100% | 100% | A | ||||
| 3 | 3 | Vestas Wind Systems A/S | Aarhus, Denmark | Machinery mfg | $226,700 | 21% | 81:1 | 45% | 100% | 100% | A | 1.5°C, SBTi | |||
| 4 | 2 | Brambles Ltd | Sydney, Australia | Furniture & general mfg | $202,193 | 13% | 67:1 | 44% | 100% | 100% | A | 1.5°C, SBTi | |||
| 5 | 4 | Taiwan High Speed Rail Corp | Taipei, Taiwan | Transit & ground transportation | $11,294 | 0% | 6:1 | 20% | 100% | 100% | A | ||||
| 6 | 10 | SMA Solar Technology AG | Niestetal, Germany | Semiconductor & electronic components mfg | $1,048,202 | 0% | 24:1 | 33% | 100% | 100% | A- | SBTi | |||
| 7 | 18 | Alstom SA | Saint-Ouen, France | Non-road transport equipment mfg | $204,115 | 0% | 30:1 | 38% | 99% | 84% | A- | SBTi | |||
| 8 | 9 | Stantec Inc | Edmonton, Canada | Business, engineering & personal services | $316,923 | 14% | 63:1 | 50% | 60% | 82% | A- | 1.5°C, SBTi | |||
| 9 | 17 | Ørsted A/S | Fredericia, Denmark | Power generation | $7,907 | 12% | 25:1 | 38% | 76% | 97% | A- | 1.5°C, SBTi | |||
| 10 | 14 | Enphase Energy Inc | Fremont, U.S. | Semiconductor & electronic components mfg | $140,492 | 7% | 14% | 100% | 100% | A- | |||||
| 11 | Voltronic Power Technology Corp | Taipei, Taiwan | Electrical equipment mfg | $121,879 | 17% | 38% | 100% | 100% | A- | ||||||
| 12 | LG Energy Solution, Ltd | Seoul, South Korea | Battery mfg | $29,486 | 17% | 29% | 100% | 100% | A- | ||||||
| 13 | 50 | NIO Inc | Shanghai, China | Cars & trucks mfg, including parts | $104,266 | 1% | 13% | 100% | 100% | A- | |||||
| 14 | 34 | First Solar Inc | Tempe, U.S. | Semiconductor & electronic components mfg | $4,211 | 0% | 25% | 100% | 100% | B+ | 1.5°C, SBTi | ||||
| 15 | Signify NV | Eindhoven, Netherlands | Electrical equipment mfg | $72,943 | 10% | 37:1 | 43% | 85% | 62% | B+ | 1.5°C, SBTi | ||||
| 16 | 5 | Nordex SE | Hamburg, Germany | Machinery mfg | $193,952 | 19:1 | 33% | 100% | 100% | B+ | 1.5°C, SBTi | ||||
| 17 | 6 | Banco do Brasil SA | Brasília, Brazil | Banks | $6,552,580 | 3% | 7:1 | 50% | 12% | N.A. | B+ | 1.5°C, SBTi | |||
| 18 | 28 | ERG SpA | Genoa, Italy | Power generation | $1,985 | 10% | 61:1 | 33% | 83% | 100% | B+ | 1.5°C, SBTi | |||
| 19 | 42 | Yadea Group Holdings Ltd | Wuxi, China | Non-road transport equipment mfg | $60,927 | 12% | 34:1 | 38% | 100% | 100% | B+ | ||||
| 20 | 24 | United Utilities Group PLC | Warrington, U.K. | Water & sewage treatment | $21,139 | 2% | 21:1 | 44% | 51% | 100% | B+ | 1.5°C, SBTi | |||
| 21 | Engie Brasil Energia SA | Florianópolis, Brazil | Power generation | $19,078 | 7% | 12:1 | 22% | 98% | 97% | B | |||||
| 22 | 44 | Maxeon Solar Technologies Ltd | Singapore, Singapore | Semiconductor & electronic components mfg | $6,951 | 11% | 0% | 100% | 100% | B | |||||
| 23 | 43 | Li Auto Inc | Beijing, China | Cars & trucks mfg, including parts | $161,739 | 0% | 83:1 | 13% | 100% | 100% | B | ||||
| 24 | 70 | Unibail-Rodamco-Westfield SE | Paris, France | Real estate & leasing | $135,454 | 215% | 32:1 | 60% | 70% | 32% | B | 1.5°C, SBTi | |||
| 25 | 61 | Pirelli & C SpA | Milan, Italy | Plastic & rubber product mfg | $23,537 | 12% | 384:1 | 40% | 23% | 12% | B | 1.5°C, SBTi | |||
| 26 | 23 | Trane Technologies PLC | Swords, Ireland | HVAC equipment mfg | $71,470 | 22% | 214:1 | 50% | 45% | 18% | B | 1.5°C, SBTi | |||
| 27 | 12 | WSP Global Inc | Montreal, Canada | Business, engineering & personal services | $221,400 | 13% | 96:1 | 30% | 64% | 41% | B | 1.5°C, SBTi | |||
| 28 | 74 | Solaredge Technologies Inc | Herzliya, Israel | Semiconductor & electronic components mfg | $56,349 | 29% | 38% | 100% | 100% | B | |||||
| 29 | Steel Dynamics Inc | Fort Wayne, U.S. | Steelmaking | $4,601 | 16% | 30% | 100% | 100% | B | ||||||
| 30 | Acciona SA | Madrid, Spain | Commercial building construction | $135,364 | 8% | 74:1 | 42% | 59% | 89% | B | 1.5°C, SBTi | ||||
| 31 | 20 | Dassault Systèmes SE | Vélizy-Villacoublay, France | IT services except telecom & hosting | $1,300,349 | 16% | 26:1 | 50% | 67% | 0% | B | 1.5°C, SBTi | |||
| 32 | 25 | XPeng Inc | Guangzhou, China | Cars & trucks mfg, including parts | $51,350 | 1% | 29% | 100% | 100% | B | |||||
| 33 | 21 | Giant Manufacturing Co Ltd | Taichung, Taiwan | Non-road transport equipment mfg | $63,737 | 18% | 96:1 | 10% | 100% | 100% | B | ||||
| 34 | 51 | BCE Inc | Verdun, Canada | Telecom providers | $79,473 | 8% | 138:1 | 33% | 32% | 90% | B | 1.5°C, SBTi | |||
| 35 | 35 | Eisai Co Ltd | Tokyo, Japan | Pharmaceutical & biotech mfg | $159,088 | 13% | 12:1 | 18% | 54% | 19% | B | 1.5°C, SBTi | |||
| 36 | 29 | Kesko Oyj | Helsinki, Finland | Grocery stores | $244,943 | 10% | 69:1 | 29% | 5% | 14% | B | 1.5°C, SBTi | |||
| 37 | 26 | Wheaton Precious Metals Corp | Vancouver, Canada | Asset management | $27,290,519 | 0% | 6:1 | 40% | 29% | N.A. | B | SBTi | |||
| 38 | 39 | EDP Renováveis SA | Madrid, Spain | Power generation | $116,669 | 3% | 13:1 | 36% | 100% | 100% | B | SBTi | |||
| 39 | 22 | City Developments Ltd | Singapore, Singapore | Real estate & leasing | $112,252 | 24% | 78:1 | 20% | 54% | 38% | B | 1.5°C, SBTi | |||
| 40 | 19 | Neste Oyj | Espoo, Finland | Refining, petrochemicals & basic organic chemicals | $13,405 | 10% | 19:1 | 25% | 34% | 88% | B | ||||
| 41 | Verbund AG | Vienna, Austria | Power transmission & distribution | $30,594 | 11% | 12:1 | 44% | 56% | 92% | B | |||||
| 42 | Atlantica Sustainable Infrastructure PLC | Brentford, U.K. | Power generation | $543 | 3% | 37:1 | 22% | 85% | 100% | B- | SBTi | ||||
| 43 | 45 | Kering SA | Paris, France | Retail, except grocery & auto | $1,379,416 | 30% | 80:1 | 54% | 40% | 10% | B- | 1.5°C, SBTi, FCCA | |||
| 44 | Nokia Oyj | Espoo, Finland | Telephones & telecom equip mfg | $182,962 | 14% | 42:1 | 50% | 47% | 38% | B- | 1.5°C, SBTi | ||||
| 45 | 46 | Tesla Inc | Austin, U.S. | Cars & trucks mfg, including parts | $458,640 | 6% | 25% | 100% | 100% | B- | 1.5°C, SBTi | ||||
| 46 | 85 | Telus Corp | Vancouver, Canada | Telecom providers | $79,612 | 9% | 322:1 | 43% | 29% | 56% | B- | 1.5°C, SBTi | |||
| 47 | 68 | Essity AB | Stockholm, Sweden | Packaging | $6,774 | 13% | 52:1 | 42% | 67% | 15% | B- | 1.5°C, SBTi | |||
| 48 | Pandora A/S | Copenhagen, Denmark | Furniture & general mfg | $643,617 | 16% | 208:1 | 57% | 97% | 0% | B- | 1.5°C, SBTi | ||||
| 49 | 58 | Novonesis A/S | Bagsvaerd, Denmark | Pharmaceutical & biotech mfg | $19,805 | 12% | 39:1 | 30% | 81% | 53% | B- | 1.5°C, SBTi | |||
| 50 | Land Securities Group PLC | London, U.K. | Real estate & leasing | $139,972 | 22:1 | 40% | 53% | 0% | B- | ||||||
| 51 | 72 | Ricoh Co Ltd | Tokyo, Japan | Computers & peripherals mfg | $114,166 | 16% | 17:1 | 8% | 55% | 46% | B- | 1.5°C, SBTi | |||
| 52 | 55 | Samsung SDI Co Ltd | Yongin-si, South Korea | Semiconductor & electronic components mfg | $20,312 | 7% | 32:1 | 29% | 90% | 97% | B- | ||||
| 53 | 36 | Radius Recycling | Portland, U.S. | Waste management | $20,010 | 4% | 57% | 95% | 100% | B- | |||||
| 54 | 64 | Cisco Systems Inc | San Jose, U.S. | Telephones & telecom equip mfg | $469,815 | 25% | 235:1 | 42% | 41% | 25% | B- | 1.5°C, SBTi | |||
| 55 | MLS Co Ltd | Zhongshan, China | Semiconductor & electronic components mfg | 42% | 44% | 100% | 100% | B- | |||||||
| 56 | 56 | Rivian Automotive, Inc | Irvine, U.S. | Cars & trucks mfg, including parts | $25,133 | 43% | 100% | 100% | B- | ||||||
| 57 | 47 | Umicore SA | Brussels, Belgium | Basic inorganic chemicals & synthetics | $46,545 | 18% | 29:1 | 33% | 14% | 67% | B- | SBTi | |||
| 58 | 48 | SAP SE | Walldorf, Germany | IT services except telecom & hosting | $440,428 | 25% | 45:1 | 39% | 21% | 1% | B- | 1.5°C, SBTi | |||
| 59 | 38 | Cascades Inc | Kingsey Falls, Canada | Packaging | $5,531 | 2% | 60:1 | 46% | 85% | 64% | B- | SBTi | |||
| 60 | 41 | Atea ASA | Oslo, Norway | Computers & peripherals mfg | $587,184 | 12% | 19:1 | 44% | 57% | 22% | B- | SBTi | |||
| 61 | 57 | Intesa Sanpaolo SpA | Turin, Italy | Banks | $1,172,815 | 14% | 101:1 | 42% | 12% | N.A. | C+ | 1.5°C, SBTi, NZBA | |||
| 62 | 53 | Novo Nordisk A/S | Bagsvaerd, Denmark | Pharmaceutical & biotech mfg | $1,035,533 | 20% | 82:1 | 50% | 4% | 42% | C+ | 1.5°C, SBTi | |||
| 63 | 87 | Prologis Inc | San Francisco, U.S. | Real estate & leasing | $1,992,330 | 2% | 169:1 | 27% | 8% | 8% | C+ | 1.5°C, SBTi | |||
| 64 | Borgwarner Inc | Auburn Hills, U.S. | Cars & trucks mfg, including parts | $48,748 | 18% | 38% | 14% | 64% | C+ | 1.5°C, SBTi | |||||
| 65 | 37 | Beazley PLC | London, U.K. | Insurance companies | $9,155,606 | 9% | 19:1 | 45% | 11% | N.A. | C+ | NZIA | |||
| 66 | 11 | Autodesk Inc | San Francisco, U.S. | IT services except telecom & hosting | $5,929,881 | 19% | 45% | 93% | 0% | C+ | 1.5°C, SBTi | ||||
| 67 | 73 | Cogeco Communications Inc | Montreal, Canada | Telecom providers | $96,028 | 5% | 50:1 | 40% | 24% | 46% | C+ | 1.5°C, SBTi | |||
| 68 | 60 | Arçelik AS | Istanbul, Turkey | Appliances & lighting fixtures mfg | $451,974 | 5% | 17% | 11% | 26% | C+ | 1.5°C, SBTi | ||||
| 69 | 71 | Apple Inc | Cupertino, U.S. | Telephones & telecom equip mfg | $6,540,700 | 16% | 50% | 67% | 0% | C+ | 1.5°C, SBTi | ||||
| 70 | 15 | Telefonaktiebolaget LM Ericsson | Stockholm, Sweden | Telephones & telecom equip mfg | $433,290 | 16% | 49:1 | 40% | 45% | 49% | C+ | 1.5°C, SBTi | |||
| 71 | 76 | Unilever PLC | London, U.K. | Personal products (retail chemical) | $131,480 | 21% | 113:1 | 42% | 4% | 0% | C+ | 1.5°C, SBTi | |||
| 72 | 69 | Equinix Inc | Redwood City, U.S. | Data processing, hosting services | $31,122 | 5% | 40% | 48% | 4% | C+ | SBTi | ||||
| 73 | 80 | StarHub Ltd | Singapore, Singapore | Telecom providers | $49,294 | 12% | 12:1 | 27% | 8% | 58% | C+ | 1.5°C, SBTi | |||
| 74 | 75 | Telefônica Brasil SA | São Paulo, Brazil | Telecom providers | $1,048,155 | 2% | 111:1 | 33% | 8% | 86% | C+ | ||||
| 75 | 79 | Sun Life Financial Inc | Toronto, Canada | Insurance companies | $1,086,324 | 19% | 101:1 | 50% | 5% | N.A. | C+ | NZAM, NZIA | |||
| 76 | 63 | Xinyi Solar Holdings Ltd | Wuhu, China | Glass & ceramics | $855 | 11% | 223:1 | 11% | 100% | 100% | C+ | ||||
| 77 | 62 | Singapore Telecommunications Ltd | Singapore, Singapore | Telecom providers | $38,975 | 6% | 23:1 | 46% | 12% | 41% | C | 1.5°C, SBTi | |||
| 78 | 97 | Biomérieux SA | Marcy l’Étoile, France | Medical equipment mfg | $95,442 | 23% | 11:1 | 38% | 5% | 1% | C | SBTi | |||
| 79 | 67 | HP Inc | Palo Alto, U.S. | Computers & peripherals mfg | $366,926 | 12% | 728:1 | 50% | 76% | 0% | C | 1.5°C, SBTi | |||
| 80 | 52 | Investec Ltd | Sandton, South Africa | Banks | $2,308,452 | 6% | 48:1 | 58% | 4% | N.A. | C | NZBA | |||
| 81 | Swiss Re AG | Zurich, Switzerland | Insurance companies | $27,930,454 | 12% | 55:1 | 33% | 11% | N.A. | C | NZIA, NZAO | ||||
| 82 | Bank of Montreal | Montreal, Canada | Banks | $1,670,219 | 8% | 61:1 | 46% | 7% | N.A. | C | NZAM, NZBA | ||||
| 83 | 93 | Vitasoy International Holdings Ltd | Hong Kong, China | Food & beverage mfg | $11,185 | 11% | 81:1 | 22% | 44% | 7% | C | ||||
| 84 | 86 | Henkel AG & Co KgaA | Düsseldorf, Germany | Personal products (retail chemical) | $128,225 | 21% | 85:1 | 41% | 21% | 1% | C | 1.5°C, SBTi, NZAM | |||
| 85 | 49 | McCormick & Company Inc | Hunt Valley, U.S. | Food & beverage mfg | $87,650 | 14% | 31% | 14% | 20% | C | 1.5°C, SBTi | ||||
| 86 | BT Group PLC | London, U.K. | Telecom providers | $183,754 | 1% | 74:1 | 50% | 13% | 44% | C | 1.5°C, SBTi | ||||
| 87 | 30 | Risen Energy Co Ltd | Ningbo, China | Semiconductor & electronic components mfg | $11,966 | 0% | 34:1 | 9% | 97% | 83% | C | ||||
| 88 | Fresenius Medical Care AG | Bad Homburg, Germany | Health care | $47,710 | 10% | 76:1 | 50% | 37% | 63% | C | |||||
| 89 | 98 | Manulife Financial Corp | Toronto, Canada | Insurance companies | $159,603 | 11% | 152:1 | 54% | 13% | N.A. | C | 1.5°C, SBTi | |||
| 90 | Anglo American PLC | London, U.K. | Mining, smelting & refining | $2,452 | 22% | 67:1 | 40% | 49% | 24% | C | |||||
| 91 | 66 | Sanofi SA | Paris, France | Pharmaceutical & biotech mfg | $154,001 | 15% | 93:1 | 38% | 11% | 1% | C | 1.5°C, SBTi | |||
| 92 | 78 | Coloplast A/S | Humlebæk, Denmark | Medical equipment mfg | $182,858 | 20% | 48:1 | 33% | 11% | 0% | C- | 1.5°C, SBTi | |||
| 93 | Natwest Group PLC | Edinburgh, U.K. | Banks | $2,854,401 | 8% | 46:1 | 50% | 4% | N.A. | C- | NZBA | ||||
| 94 | KBC Groep NV | Brussels, Belgium | Banks | $1,395,043 | 6% | 52:1 | 31% | 3% | N.A. | C- | |||||
| 95 | 96 | IGM Financial Inc | Winnipeg, Canada | Asset management | $4,898,819 | 17% | 47:1 | 33% | 4% | N.A. | C- | NZAM | |||
| 96 | 90 | BNP Paribas SA | Paris, France | Banks | $2,501,944 | 6% | 44:1 | 46% | 2% | N.A. | C- | SBTi, NZAM, NZAO, NZBA | |||
| 97 | Taiwan Cooperative Financial Holding Co Ltd | Taipei, Taiwan | Banks | $431,827 | 6% | 20% | 12% | N.A. | D+ | 1.5°C, SBTi | |||||
| 98 | 100 | Sysmex Corp | Kobe, Japan | Instrumentation & other electronic mfg | $245,929 | 21% | 21:1 | 8% | 37% | 0% | D+ | SBTi | |||
| 99 | PNC Financial Services Group Inc | Pittsburgh, U.S. | Banks | $303,387 | 9% | 152:1 | 33% | 3% | N.A. | D+ | |||||
| 100 | Turkiye Sinai Kalkinma Bankasi | Istanbul, Turkey | Banks | $9,473,205 | 12% | 18% | 15% | N.A. | D+ | NZBA |
Note: Banks, asset management and insurance peer groups are not assessed on the sustainable investment KPI. The weight of this KPI has been reweighted to the sustainable revenue KPI.
download full results
methodology
press release
previous rankings
Purchase Historical Global 100 Dataset
Bumpy Road
For most of its 20-plus-year history, the Global 100 has outperformed its MSCI ACWI benchmark on total investment return. However, the MSCI ACWI nudged ahead of the Global 100 this year thanks mainly to the updraft in AI stocks, and, to a lesser extent, the rally of oil and weapons stocks, sectors that are not particularly strong on sustainability. This updraft effect, combined with high interest rates that depressed stock prices of firms spending big on transforming their assets (such as those leading the clean energy transition), led to the Global 100 underperforming over the past two years.
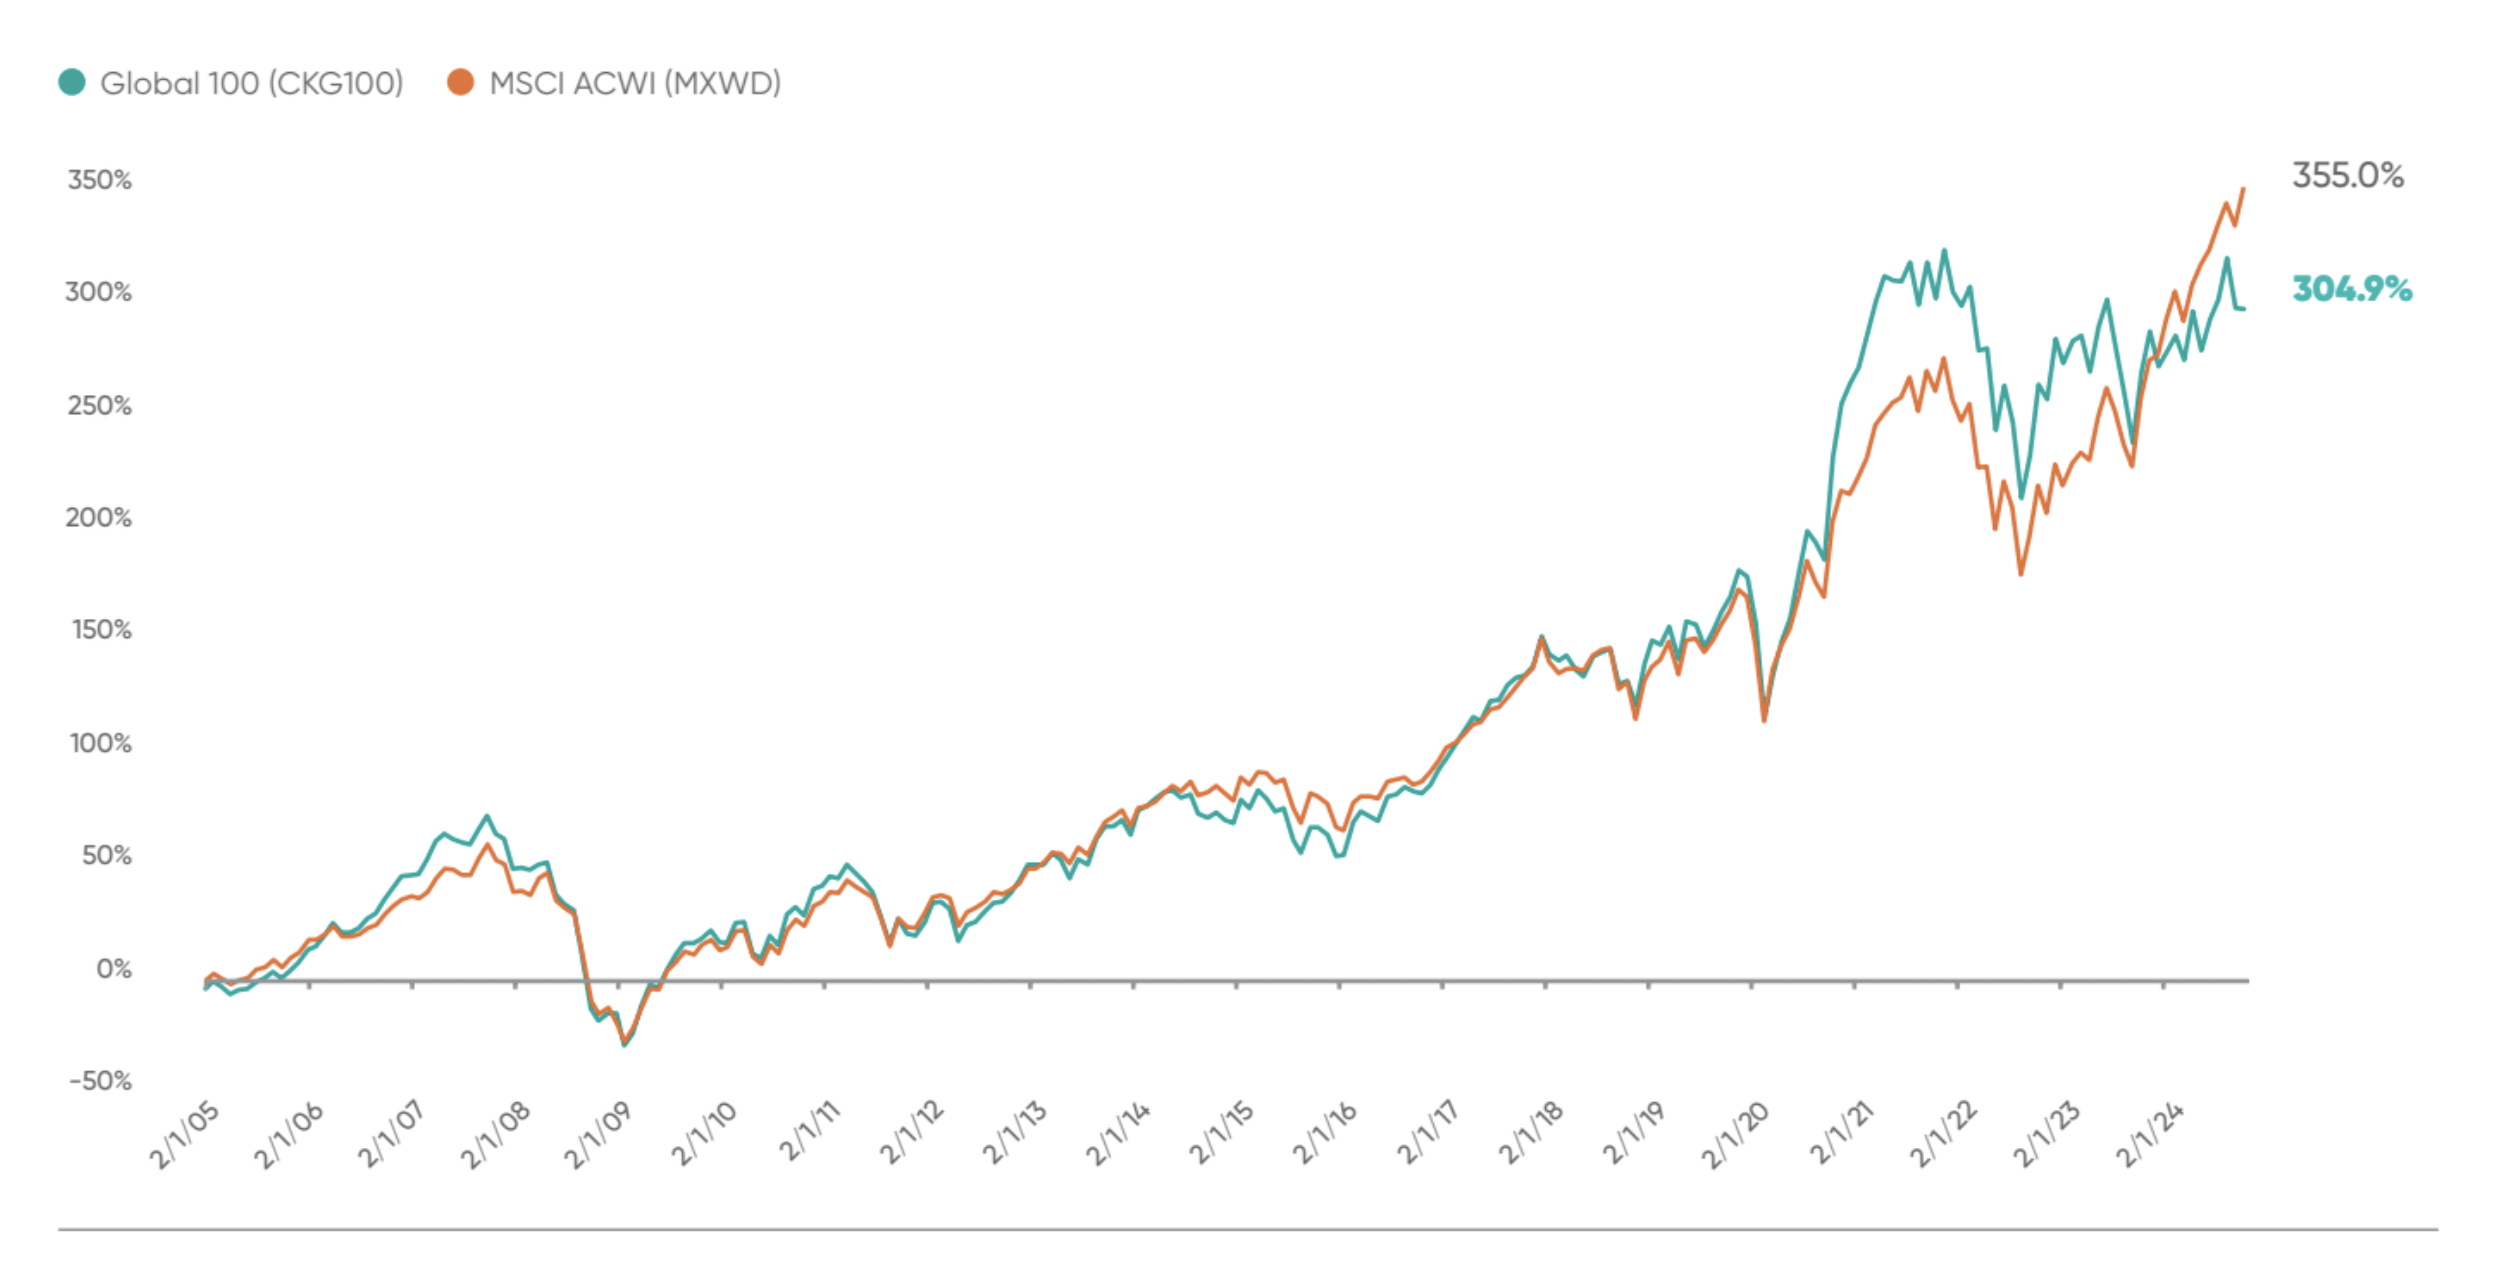
That said, the world’s top companies are staying the course, knowing that speed bumps won’t stop progress toward a more sustainable and inclusive economy.
French-based Schneider Electric SE climbed to the top of the 2025 Global 100, up from seventh place last year, thanks to a high level of sustainable investment and revenue, its leading performance on gender diversity, and the low carbon intensity of its production. Like the majority of companies on the Global 100, Schneider isn’t a consumer-facing household name; rather, it provides the nuts, bolts and technology for the green transition, including building energy controls, off-grid solar and EV charging and grid automation (read our top company profile). It also happened to rake in record-breaking revenues in 2024, built on continued demand for energy management.
Last year’s leader, Australian waste management company Sims Ltd., is in second place this year, while Danish wind manufacturer Vestas Wind Systems S/A is in third. Both Sims and Vestas are pure-play companies that derived 100% of their revenue from and allocated 100% of their investment to sustainable projects.
New to the Global 100 ranking for 2025 are Türkiye Sinai Kalkinma Bankasi, a national industrial bank based in Istanbul, and American manufacturer BorgWarner Inc., which produces battery systems, fast chargers and electric motors for mobility applications. Michigan-based BorgWarner’s high growth in sustainable revenue was particularly fuelled by the popularity of EV components, such as its electric powertrains.
Danish jewellery manufacturer Pandora also joined the ranking for the first time as its recycled gold and silver inputs jumped to 97% in 2023, from 61% the previous year.
Canada has 11 companies represented in the Global 100, second only to the United States, which has 15. The Canadian contingent is led by engineering firms Stantec Inc., which aimed 82% of its capital expenditure at sustainable investing in 2023, and WSP Global Inc., which earned 64% of its revenue from sustainable sources that year.
Canadian insurers Sun Life Financial Inc. and Manulife Financial Corp. both earned spots in the Global 100 ranking, as did telecommunications giants BCE Inc., Telus Corp. and Cogeco Communications Inc. (The Corporate Knights ranking allocates spots by sectors to reflect the global economy. For example, 16% go to financial institutions and 7% are reserved for telecoms.)
Green snakes and ladders
Staying on the ranking can be a challenge. The Bank of Montreal had been dropped from the 2024 ranking but regained its place in this year’s version. The bank improved on a number of metrics, notes Matthew Malinsky, director of sustainable economy intelligence for Corporate Knights. BMO saw gains in sustainable revenue, its CEO-to-average-worker pay ratio, racial diversity and its sustainability pay link in which 10.3% of the CEO’s pay is tied to achieving the company’s social and environmental goals. The bank has a rapidly growing green loan book and has provided just under $40 billion in renewable-energy financing since 2019.
>>Access Sustainable Economy Intelligence on thousands of large companies>>
Anglo American is also new to the ranking, bumping off Canada’s Teck Resources (which had been on the list for six straight years) as a result of Anglo’s sustainable investment growth of 19% and increases in sustainable revenues from mines tied to low-carbon-economy minerals such as copper and nickel.
Brookfield Renewable Partners also dropped from the ranking, despite its strength in sustainable investing and revenues. Brookfield was red-flagged by the non-profit shareholder advocacy group As You Sow over its investments in Westinghouse Electric Company, which manufactures rods that produce tritium used for nuclear weapons.
2025 Global 100 vs. the rest
| Indicator | 2025 G100 | 2024 G100 | 2025 average* | 2024 average |
|---|---|---|---|---|
| Sustainable revenue (% total revenue) | 53% | 51% | 15% | 16% |
| Sustainable investment (% total investment) | 58% | 55% | 15% | 17% |
| Executive gender diversity | 25% | 24% | 18% | 19% |
| Board gender diversity | 36% | 35% | 25% | 25% |
| Executive racial diversity | 10% | 11% | 10% | 8% |
| Board racial diversity | 12% | 14% | 12% | 10% |
| Cash taxes paid (% of profits) | 14% | 14% | 9% | 14% |
| Carbon productivity ($ sales/tonnes GHGs)1 | $1,305,869 | $927,244 | $640,248 | $491,909 |
| Energy productivity ($ sales/GJ energy used)2 | $95,316 | $479,161 | $93,071 | $160,630 |
| Sustainability pay link | 80/100 | 64/81 | 2830/8062 | 1882 / 6330 |
| CEO–average worker pay ratio | 79:1 | 85:1 | 60:1 | 74:1 |
* Large publicly traded companies (with more than PPP$1 billion in annual revenue), excluding the Global 100.
1 – For comparison purposes, the scope 2 portion of the Carbon Productivity numbers in this chart are calculated according to a market-based methodology. Please note that in prior year publications, scope 2 emissions were calculated using a location-based methodology
2 – Companies that have no net non-renewable energy use do not receive an energy productivity value but receive a 100% energy productivity score.
Room for improvement
There are areas where all Global 100 firms can improve. The top firms may be leaders in pursuing gender diversity on their boards, but only a handful (Autodesk, SMA Solar and Taiwan Cooperative Financial Holding Co Ltd) have reached gender parity at the executive level. And Global 100 companies perform no better in terms of racial diversity than the broader universe of large publicly traded companies.
The road to decarbonization and a more inclusive economy will become bumpier in the coming years given the current political backlash. However, corporate sustainability leaders appear to be committed to progressing down that path, as evidenced by more than two decades of the Global 100 rankings.
Shawn McCarthy is an Ottawa-based writer.
CLIMATE
|
1.5˚C
Business Ambition for 1.5˚C |
SBTi
Science Based Targets Initiative |
FCCA
Fashion Charter for Climate Action |
NZAM
Net-Zero Asset Managers Initiative |
NZAO
Net-Zero Asset Owners Alliance |
NZBA
Net-Zero Banking Alliance |
|---|
DOWNLOAD FULL RESULTS
Get the complete Excel scorecard for the Global 100 most sustainable companies of 2025
Methodology
The Global 100 methodology uses a mix of fixed and variable-weight ESG and sustainable-economy key performance indicators (KPIs) to score companies against their peers. We measure the share of revenues and investments that are included in the Corporate Knights Sustainable Economy Taxonomy and percent rank those ratios against the company’s peer group (CKPG). We then give equal weight to the ratios and the percent ranks in awarding up to 25 points for sustainable revenue and up to 25 points for sustainable investment, for a total of 50 possible points.
The other 50 points in the Global 100 are allocated to 22 ESG KPIs, covering environmental, social, governance and supplier sustainability themes.
In addition, penalties can be levied against overall scores for low performance on the following indicators: productivities for water, waste, VOC, NOx, SOx and PM; cash taxes paid; injury rate; and fatalities. Up to five points are deducted for companies that have been levied fines above a percentage threshold of their revenue compared to other companies. Lastly, the political influence KPI may earn a company 2.5 bonus points.
After analyzing data for 25 KPIs, using the Corporate Knights methodology, this year’s overall scores were converted to letter grades.

Awarded to the top company

Above 75%

70% – 75%
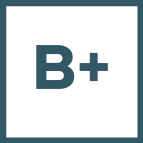
65% – 70%

60% – 65%
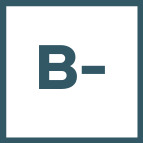
55% – 60%
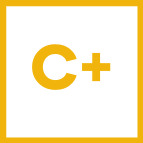
50% – 55%

45% – 50%
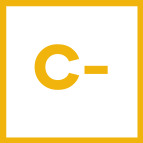
40% – 45%

35% – 40%

30% – 35%

25% – 30%
To learn more about Corporate Knights research, head to corporateknights.com/research-products.
Previous Rankings
2024 GLOBAL 100
2023 GLOBAL 100
2022 GLOBAL 100
2021 GLOBAL 100
