The Clean Capitalist database covers 7,000 securities (comprising more than 85% of global market capitalization) including all primary public equity securities with a market cap over $2 billion and/or listed on major national and global indices[1], as of the end of the most recent quarter.
Summary Methodology: In order to calculate the potential impact of cleaning a portfolio, we go through the following steps. For each rebalancing date[2], we remove all companies from the original portfolio for which we do not have the requisite market data. This is the Uncleaned Portfolio. Then we remove all other companies who fail the user-defined selection criteria. We then readjust weights according to the user preference and re-balance quarterly, calculating portfolio returns monthly to determine by how much the Clean Portfolio over or underperforms the Uncleaned Portfolio on a total three year return basis.
Detailed Methodology:
- Remove all securities which do not have the requisite market data[3] as of end of the most recent quarter. This list constitutes the Uncleaned Portfolio.
- To determine the Clean Portfolio make-up, we remove companies from the Uncleaned Portfolio who fail any of the below filters selected by the user.
- Inefficient Polluters: all securities in high carbon sectors[4] that either have higher than median weighted CO2e intensity (scope 1&2 CO2e/sales) than their Sustainability Accounting Standards Board Level 3 Sustainable Industry Classification System™ peers[5] within the portfolio, or do not report their CO2e.
- Carbon Underground 100 Coal.[6]
- Carbon Underground 100 Oil.[7]
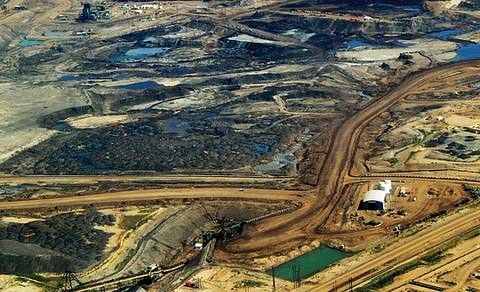
- Oil sands. All securities that are members of the Oil Sands Index[8], as of the end of the most recent quarter.
- Utilities with more than [x defined by user] % coal generation. All utilities companies that have more than x% generation from coal, as verified by a South Pole Group.[9]
Note: If a company is deemed “green[10],” it overrides the above exclusions, as there are cases in which a company has higher direct carbon emissions, but the overall lifecycle impacts of their core product is positive, such as manufacturers of insulation or solar panels.
- Weights of the excluded securities are set to 0; for the Uncleaned Portfolio remaining weights are allocated on a free float market capitalization basis, and for the Cleaned Portfolio remaining weights are allocated according to the re-investment criteria selected:
- In green companies: the weights of the green companies are increased proportional to their free float market capitalization, in such a way that the sum of the weights in the portfolio equals 1.
- Sector Neutral: the weights of the remaining securities in the portfolio are re-allocated within the altered sectors to remaining companies proportional to their free float market capitalization, such that sector neutrality relative to the Uncleaned Portfolio is maintained.
- Free Float Market Cap: the weights of the remaining securities in the portfolio are re-adjusted based on their free float market capitalization, in such a way that the sum of the weights in the portfolio equals 1.
Note: If there are no green companies in the portfolio on a specific rebalancing date, the algorithm defaults to Sector Neutral. If Sector Neutrality cannot be accomplished due to the absence of a particular sector in the Cleaned portfolio, the algorithm defaults to a free float market capitalization re-investment strategy. On subsequent rebalancing dates the user-defined weighted method is re-tried.
- Once we have obtained the weights of the Uncleaned Portfolio and the Cleaned Portfolio, we proceed to calculate the portfolio return by using the Bloomberg monthly total return including gross dividends for each security. Rebalancing takes effect immediately after the rebalancing date. The difference is the $ amount by which the Cleaned Portfolio outperformed or underperformed the Uncleaned Portfolio based on the specified initial USD investment amount in the two strategies three years ago to the most recent quarter end.
Copyright © 2015 Clean Capitalist — a project of Corporate Knights
[1] ASX 200, Bovespa, CAC 40, DAX 30, FTSE 100, FTSE All Shares, FTSE Bursa Malaysia KLCI Index, FTSE/JSE Africa Top40 Tradeable Index, Hang Seng, IBEX 35 Index, KOSPI 200, Nikkei 225, OBX 25, OMX Stockholm 30 Index, Russell 1000, S&P 500, S&P BSE SENSEX Index, S&P Global 1200, S&P/TSX Composite, Stock Exchange of Thailand (SET 50) Index, STOXX 600, Straits Times Index STI, Swiss Market Index.
[2] Rebalancing dates: March 31st, June 30th, September 30th, December 31st.
[3] Sales, free float market capitalization, and total returns used to calculate index weighting are all obtained from Bloomberg. All figures are obtained in USD. All Carbon data provided by South Pole Group.
[4] High carbon sectors generally account for over 75-80% of a global portfolios weighted carbon intensity and are comprised of the following GICS sectors: Energy, Industrials, Materials, Utilities.
[5] SASB developed the Sustainable Industry Classification System™ (SICS™), which categorizes industries based on resource intensity and sustainability innovation potential. SICS is structured in 3 levels: industry, sub-sector, and sector.
[6] The Carbon Underground 200TM identifies the top 100 public coal companies globally and the top 100 public oil and gas companies globally, ranked by the potential carbon emissions content of their reported reserves, as of the end of the most recent quarter. The reserves of these companies total 555 gigatons (Gt) of potential CO2 emissions, almost five times more than can be burned for the world to have an 80% chance of limiting global temperature rise to 2°C (3.6° F).
[7] See above.
[8] Oil Sands Sector Index constituents available here.
[9] This data is provided by South Pole Group’s database of coal utilities which includes all GICS level 1 Utilities listed on the MSCI World, FTSE All World Developed Index, Russell 1000 and MSCI Emerging Markets Index. The % of electricity generation from coal is determined by South Pole Group based on available information as of the end of the most recent quarter.
[10] Green companies include all companies who either: (a) who earn at least 20% of revenue from environmental markets according to FTSE), or (b) derive at least 25% of revenue from renewable energy, energy smart technologies, carbon capture and storage (CCS), and carbon markets – according to Bloomberg New Energy Finance (BNEF) – and the company has a market capitalization of at least (USD)$1b as of the end of the most recent quarter. To arrive at its estimate, BNEF assesses an organization’s sectors and subactivities within these clean energy areas, and then calculates an estimate using reported segmented revenues (as the preferred metric), along with any other available metrics such as segmented Earnings Before Interest, Taxes, Depreciation and Amortization (EBITDA), GWh breakdown of energy production and megawatt breakdown of generation assets.
Click here to go back to the Decarbonizer landing page.


