It’s mid-summer and the air is thick. Thirteen riders form a peloton in the 10th stage of Le Tour De France, grinding their way through the French Alps. All are in pursuit of the coveted yellow jersey, cycling’s most prestigious prize. But in the mountains with 10 more stages in the tour to go, it’s still anybody’s race. The riders are close together, drafting, and there are no breakaways yet.
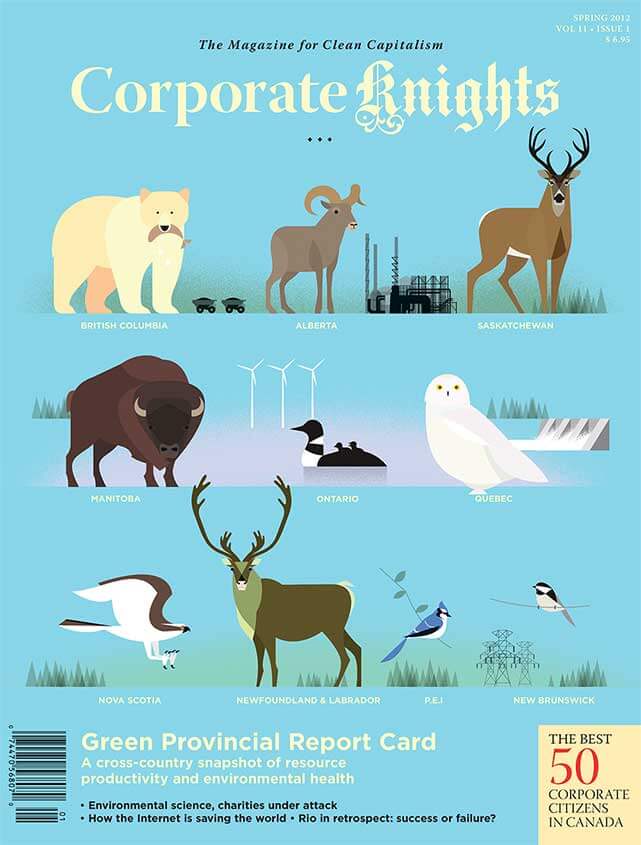
Canada’s provinces and territories have clearly formed a peloton in the 2012 Corporate Knights Green Provincial Report Card, with Ontario and British Columbia leading the pack and Alberta and Saskatchewan struggling to keep up. But no one has yet broken away in the race to become Canada’s greenest province or territory.
We evaluated their environmental performance using a series of 35 indicators grouped into seven categories: air and climate, water, nature, transportation, waste, energy and buildings, and innovation. Building on previous CK green province reports, this year’s ranking methodology used the most current available data (ranging from 2008 to 2011). Much of it came through federal sources that allowed for direct comparisons between Canada’s 13 jurisdictions. One major source was Environment Canada’s new Canadian Environmental Sustainability Indicators (CESI) database, which was just made publicly accessible last year.
Our aim is to give readers a snapshot of the environmental health and resource productivity of our provinces and territories, and in doing so give a sense of how serious each jurisdiction is in dealing with such challenges. As you read, it is important to note that these indicators are influenced not just by past provincial policy decisions, but also by municipal and federal policies. They also don’t reflect the impacts of relatively new policies and programs, which will no doubt affect the conclusions of future reports.
Here is a look at who’s leading the way in each category.
Air and climate
With a score of 87 per cent, the territory of Yukon secured top spot in this category by ranking first in four of nine indicators. Most notably, Yukon has reduced its greenhouse-gas emissions by 41.3 per cent between 1990 and 2009, greatly exceeding the Kyoto target of 6 per cent below 1990 levels by 2012. Per dollar of GDP it also has the lowest levels of fine particulate, mercury and chromium emissions.
Ontario, which scored 83 per cent, stood out as the top province by having the highest GDP per kilotonne of nitrogen oxide (NOx) and volatile organic compounds (VOC) emitted, and among the highest GDP per megatonne of GHG emissions. Ontario, like the Yukon, is the only other jurisdiction to achieve Kyoto compliance.
..
Water
Northwest Territories (N.W.T.) ranked first with a score of 80 per cent, taking top spot in half of the category indicators. Perhaps unsurprising for a sparsely populated jurisdiction, all monitored stations in N.W.T. were observed to have normal or high water quantity. Most impressive was N.W.T.’s water productivity. It had the highest GDP per litre of water use, with Alberta following closely behind.
The two provinces, however, with the highest overall score in this category were Saskatchewan and Manitoba, each scoring 78 per cent. They showed low counts of toxins released into water supplies and high rates per capita of secondary wastewater treatment.
..
Nature
The Yukon (82 per cent) and Alberta (81 per cent) scored significantly higher than others, each ranking first in two indicators. The Yukon ranked tops when it came to preserving the ecological integrity of its national parks. It also shared top spot with Alberta (and P.E.I.) by achieving greater than one visit per capita at its national parks in the 2010/2011 season.
Alberta – along with Quebec and Ontario – also had the highest percentage of forestland protected under the FSC-certified management indicator, with 5,656,930 hectares FSC-certified in 2010. B.C. has the most overall protected areas, followed closely by Alberta.
..
Transportation
Nunavut scored 95 per cent here, putting it far above all other provinces and territories. Kilometres driven per capita for both light duty (940.3 km) and heavy duty (62.7 km) vehicles were well below the national average of 9,069 km and 639.8 km, respectively. This may be partially explained by the lack of road and highway infrastructure in the territory. Only British Columbia came close to Nunavut’s transportation performance – at least with respect to heavy vehicles, which in the province travelled an average of 132.9 km per capita.
Manitoba and Newfoundland had the highest fuel efficiency for heavy duty vehicles, while Quebec and Nova Scotia had the most fuel-efficient light duty vehicle fleets.
..
Waste
With a score of 71 per cent Nova Scotia came out clearly on top, showing the highest efficiency in the area of waste disposal. The province earned $80,000 in GDP for every tonne of disposed waste, making it twice as efficient as lowest-ranking provinces Manitoba and Quebec. No data was available for the territories.
Nova Scotia also scored relatively well for its waste diversion efforts. The province diverted 308 kg of material per capita annually, exceeding the national average of 251 kg/capita diversion and well within striking distance of leaders B.C. and New Brunswick.
..
Energy and buildings
Many provinces and territories are struggling in this category and there is no clear front-runner. Overall winner B.C. scored a lacklustre 60 per cent. It didn’t get highest score in any single indicator but was relatively strong across most of them. It received 89 per cent of its electricity generation from a combination of hydroelectric, wind, solar and other renewables, and had a total of 9,820 grant applications for the ecoENERGY home retrofit program last year, working out to about 22 applications per 10,000 people – higher than the national average.
..
Innovation
On the other hand, B.C. was the clear leader in the category of innovation with an overall score of 93 per cent. It achieved a very high grade for both the amount of venture capital its green technology businesses are attracting and the number of cleantech companies per capita that call the province home. Between 2002 and 2011 venture capitalists have invested over $138 per capita in B.C.’s green startups; only Ontario comes close to this with an average investment of $80.50 per capita. With 160 cleantech companies in total at the end of 2011, B.C. also has one of the highest numbers of companies per capita.
..
Where do we go from here?
In at least one of the seven categories in our 2012 Green Provinces Report Card we see the Yukon, Northwest Territories, Alberta, Nunavut, Nova Scotia and B.C. leading the way. Ontario didn’t lead any single category, so how did it come out on top overall?
No one province or territory excels in every category, similar to cyclists in le Tour. Some achieve highest or second highest scores in one category, but lowest scores in other categories. Ontario and B.C. both topped our 2012 ranking because they achieved highest or second highest scores in multiple categories, and have no extremely low scores. Even so, out of an ideal overall grade of 100 per cent Ontario achieved only 61 per cent and B.C. achieved a grade of 60 per cent, which relative to other provinces gave them an A– letter grade.
There’s room to do so much better. CK has calculated that if all provinces and territories got the highest score in each of the seven categories measured in our 2012 report, the Canadian average would be 86 per cent, making our nation more than just an excellent student. Indeed, it would put us in the category of green economy genius.
It’s clearly doable. For each indicator of each category, it has already been done by at least one province or territory. To pursue such best practices on a national scale, however, will require much greater cooperation, collaboration, and information sharing than experienced so far.
Behind that is the belief that each and every province and territory can achieve continued economic prosperity without needless sacrifice to the environment, and the natural capital necessary to sustain our long-term well-being.
Click here to go back to the ranking landing page.


